5/5 ITM on the EUR/USD on June 6, 2013
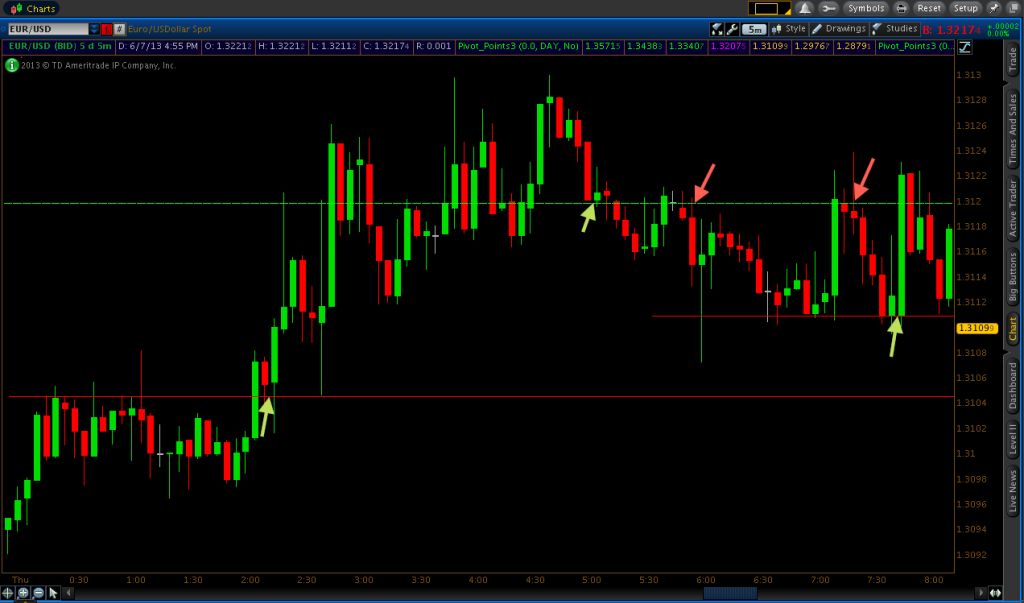
I traded the EUR/USD from around 2AM-7:30AM EST on Thursday and found five set-ups to trade.
The first trade I took occurred on the 2:15 candle where I was looking at a call option on a retrace back to a previous resistance area. For about one hour, price had been consolidating around the 1.31046 price level, but finally broke through it and closed above just after 2AM. The EUR/USD acted like it wanted to move higher, so I began singling out a retrace back toward 1.31046 as potential call option territory. The retrace happened right off the bat, with the 2:10 candle coming back down to 1.31046.

I almost always never take a touch of a level right away as I did when I traded binary options in the past. I believe it’s a higher-probability play to wait for a touch of a support or resistance level, followed by a rejection, and taking a subsequent touch (if it occurs) on the next candle. That’s exactly what I did for this particular trade – not taking the touch of 1.31046 on the 2:10 candle, but waiting for the rejection to help me validate that the breach of 1.31046 was a genuine signal that the asset wanted to reach new highs. So I took the trade on the touch of that level on the 2:15 candle. It turned out to be a great trade. It was up by fifteen pips at one point, which is a pretty significant move for that early in the morning before closing out as a ten-pip winner.
The price action became pretty volatile after that even though it still maintained a bias toward the north-side. I had that green support 1 line (1.3120 price level) to look at as a potential area of resistance, but based on how the price was moving it didn’t seem very prudent to be taking trades. Once price broke through 1.3120, I had considered call options upon a retrace back down to 1.3120 but there wasn’t a lot of sensitivity shown to that level at the moment so I decided to bypass any trades there. This is why I feel so strongly about waiting for more validation before taking any S/R-based trades (i.e., never taking the touch right away). If I had traded the support 1 line indiscriminately from 2:30-4:30, I definitely would have had some losing trades.
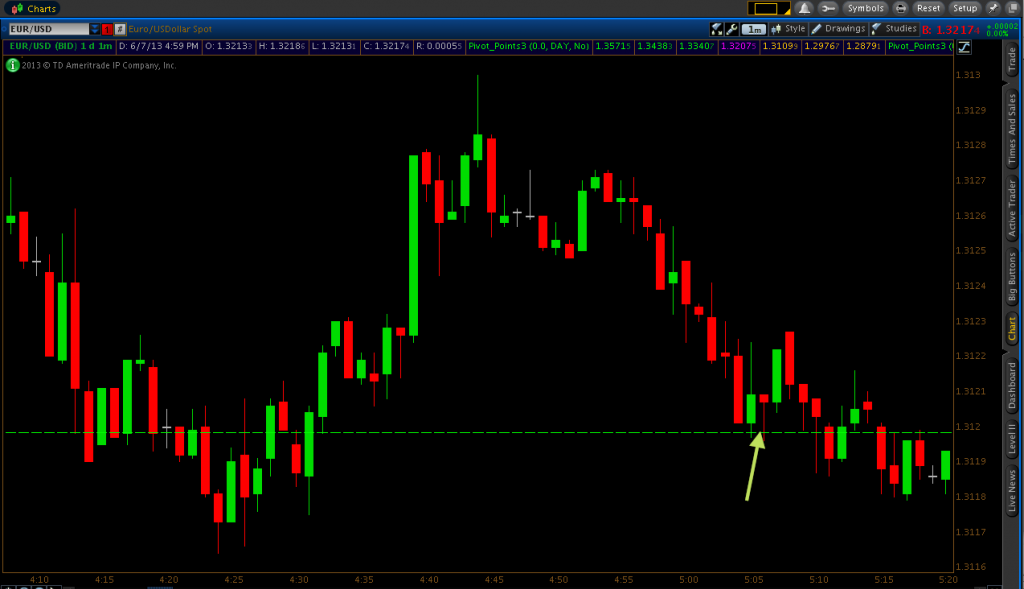
I did, however, take a call option on the 5:05 candle at 1.3120. The trend was still definitely up for the morning and I had the support 1 (green) line working in my favor to support the set-up. Support 1 hadn’t exactly held as a support or resistance area, but it had held relatively well on the 5:05 candle alone. I actually briefly went down to the one-minute chart (see image below) and the price action was favoring a hold of 1.3120 on that time compression so I went ahead and made the call option. It was also just over five minutes before the option’s expiry so I only needed a very short-term bounce or hold of 1.3120 for it to be a successful trade.

Admittedly, I got a little bit lucky with this trade, as it only won by about half-a-pip and was actually against me about ten seconds before the option expired before coming back up into the green.
After the call option, price retraced below support 1. Therefore, following the general principle that old support can turn into new resistance (and vice versa) I began pegging 1.3120 as a potential put option set-up. The 5:30 candle came up and touched 1.3120, but I didn’t take a trade there, preferring to wait. It touched again on the 5:40 candle and closed just above the support 1 line. I wasn’t exactly sure if the level would hold or if it would go back up above it. Then we saw a doji form on the 5:45 candle, which is always a possible indication of an impending reversal, and holds more indicative value when this candle type forms along a line of support or resistance. So I decided to take a put option near the beginning of the 5:50 candle and rode that for a five-pip winner.
Price continued to trend lower after that and I had our old level of 1.31046 eyed as a place for potential call option set-ups, with 1.3120 still in play for put options. However, a line of support formed approximately around the 1.31109 price level between 6:40AM and 7:40AM before heading back up to support 1. As a result, 1.31109 became my targeted level for call options instead of all the way down at 1.31046.
In the meantime, I actually ended up taking a put option on the 7:20 candle at 1.3120. Price had a relatively large degree of momentum on the 7:10 candle and broke nearly three pips above 1.3120 before wicking back down. The 7:15 bar was a red “hanging man” candle that closed below the level. So I decided to take a trade on the touch of 1.3120 when it came back up to that price level on the 7:20 candle. Initially, there was a break above my entry point by about four pips and I legitimately believed that price would continue higher. But it turned out to be a false break and the put option ultimately held for a four-pip winner.
As a general note, however, whenever you observe a false break of a price level, be very wary of trading it later on in the trading session. Unless, of course, new price data leads you to believe that it continues to be a “safe” area to trade. Although I stopped trading soon after that trade, price eventually did completely bust through 1.3120 – to the tune of nearly 200 pips. And 200-pip days rarely happen. And fortunately enough, I had a long EUR/USD spot forex trade in place until Friday morning and captured the entire move. :) (For those interested, I’ll write about it on my strategy thread on BOD)
I still had one final trade for the day, which was down at our new support level that was formed at roughly 1.31109. Price had come down and rejected the level on the 7:35 candle, before going back up on the subsequent candle. I did not take the call option on the 7:40 candle. First off, I had a lot of time to get into the trade, with still a full fifteen minutes before expiration. And second, momentum had been down over the past half-hour, so I wanted to make sure I’m simply not fighting against where the market wants to go. But with the 7:40 candle showing validation of 1.31109 as a support level, I took a call option at the touch of that price on the 7:45 candle. The trade turned into a ten-pip winner and gave me a 5/5 ITM day.