Uptober Starts With Whale Sell-Off. 30,000 BTC Change Hands
Price Faces Rejection at Key Levels, 50-Day MA Holds the Balance
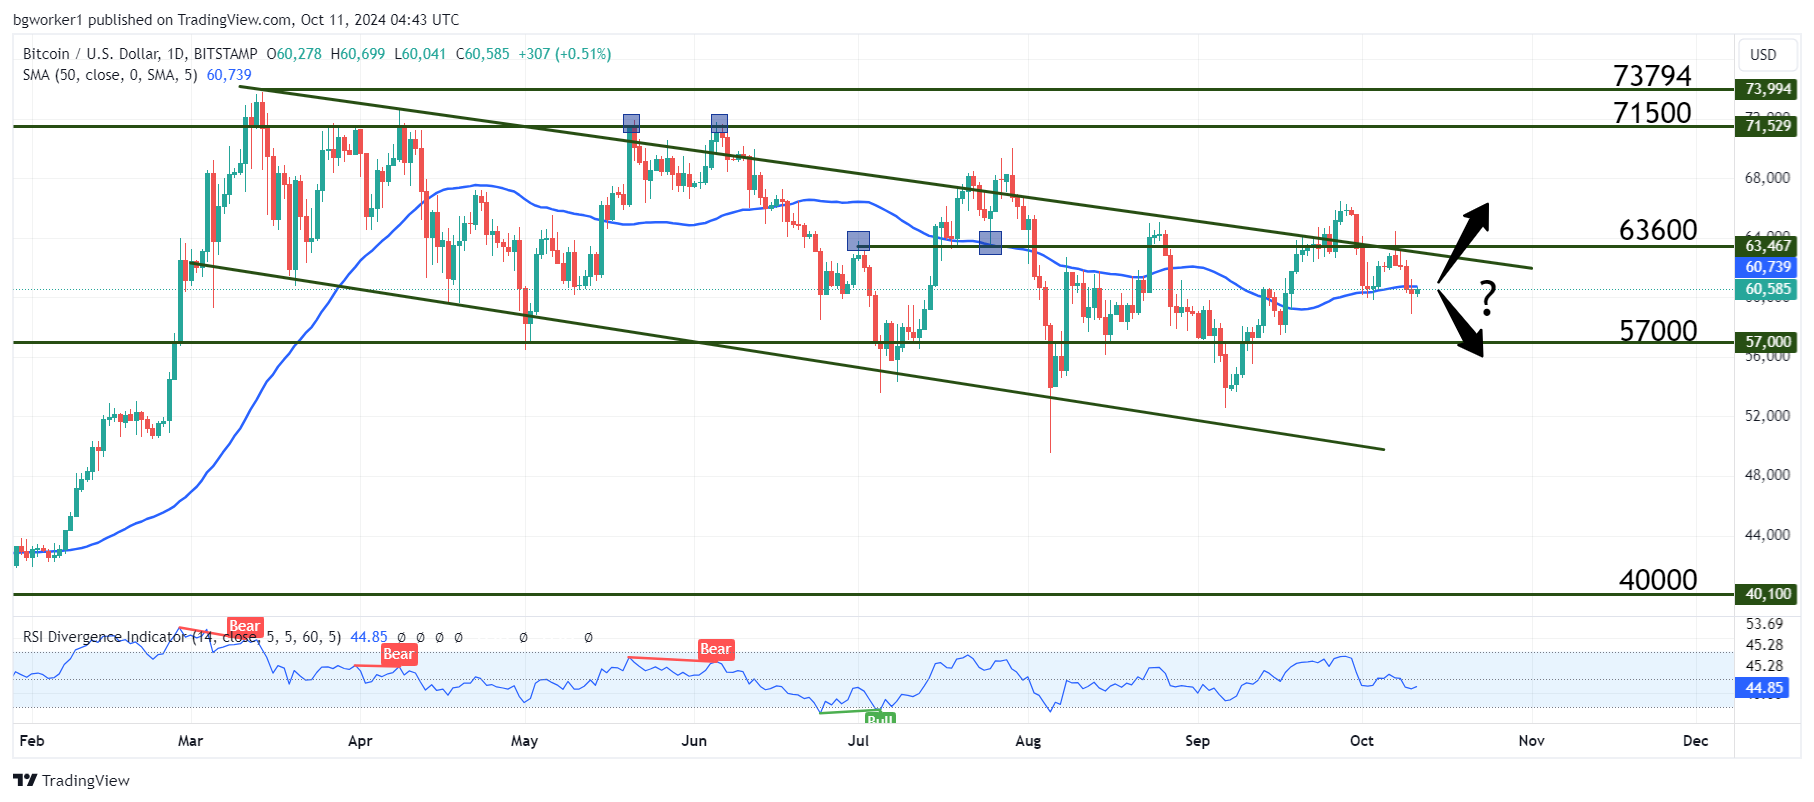
Uptober is really letting down its Bitcoin fans thus far: it started with a significant drop of about $3,000. However, all the losses of the month were erased by October 7, bumping up hopes of a recovery. Yet, those hopes were short-lived and the bulls failed to break the resistance at $63,600.
At the moment, Bitcoin is showing another rejection at the top of the descending channel and is in danger of falling through the 50-day Moving Average, which would probably be a signal to sell for a lot more people.
This comes just after a major “whale” sell-off. Large holders of Bitcoin are commonly referred to as whales and their movement often plays a big role in Bitcoin’s price action. When the price is moving sideways or ranging without clear direction and whales are accumulating, we can expect bullish movement to follow. On the other hand, when whales are moving their digital assets to exchanges, this is an indication that they are about to sell.
Well, now the situation is a bit different: whales have already sold. According to on-chain analytics firm Santiment, whales have sold around 30,000 BTC in the last few days, amounting to a total of $1.83 billion.
But, according to a recent analysis, this sell-off coincides with short-term BTC holders exiting the market. Often, when short-term holders sell, their coins end up in the hands of more resilient holders, investors who don’t mind the ebbs and flows of the market. Also, this could be an opportunity for other whales to start accumulating, which may lead to a rally.
Chart Analysis – BTC/USD
At the time of writing, Bitcoin is changing hands at $60,600 after dropping as low as $58,800 during yesterday’s trading session. The flagship cryptocurrency has been mostly flat for the last 7 days, having lost 0.67%.
After breaching the 50-day Moving Average, the pair printed a candle with a small body and a very long wick in its lower part, which is a sign of bullish pressure and rejection at the 50 MA. It would have been a stronger signal if the candle would have closed above the moving average but the long lower wick is a bullish sign nonetheless.
If the bulls manage to take the price above the 50 MA and close a candle there, the chance of a move above the resistance at $63,600 will increase significantly. This could also mean that the pair will finally be free of the descending channel.
On the other hand, a daily close below the 50 MA would increase the bearish pressure and will make $57,000 the next probable destination.