Bitcoin Breaks the Mould. It May Be UPtober After All
Bitcoin ETFs Lead The Charge – The Descending Channel is Obliterated
It finally happened: Bitcoin broke the descending channel that’s been trapping it since March. And it looks like this time it’s the real deal. After another false break in late September, the flagship cryptocurrency dipped as low as $59,000, but this week all the losses were erased and Bitcoin reached its highest price since late July.
A big role in the climb can be attributed to institutional money, mainly the spot Bitcoin ETFs. During this week alone, Bitcoin ETFs have seen combined inflows of more than $1.6 billion, which makes it the most successful week since their inception.
Of course, other factors have contributed to the latest climb, among which is the Federal Reserve’s decision to trim the interest rate. Although the Dollar Index (DXY) has been climbing lately, it looks like the appetite for Bitcoin is greater, as evidenced by the charts: the greenback is “beating” most of its counterparts but Bitcoin is “beating” the greenback.
It looks like looser monetary policy is boosting the BTC ETFs but retail investors are still not impressed by Bitcoin’s performance. At least not to the point where FOMO kicks in. FOMO – Fear Of Missing Out – usually sets in when an asset climbs ferociously, making more traders want to join in. Most of the time, the entry is driven by fear of missing the ship rather than a sound analysis of the asset.
We will have to see if FOMO kicks in and if the spot ETFs will continue to perform as well as they did this week. Thus far, it looks like October is shaping up to become UPtober but don’t forget that periods of frenzy buying are often followed by pullbacks or stagnation.
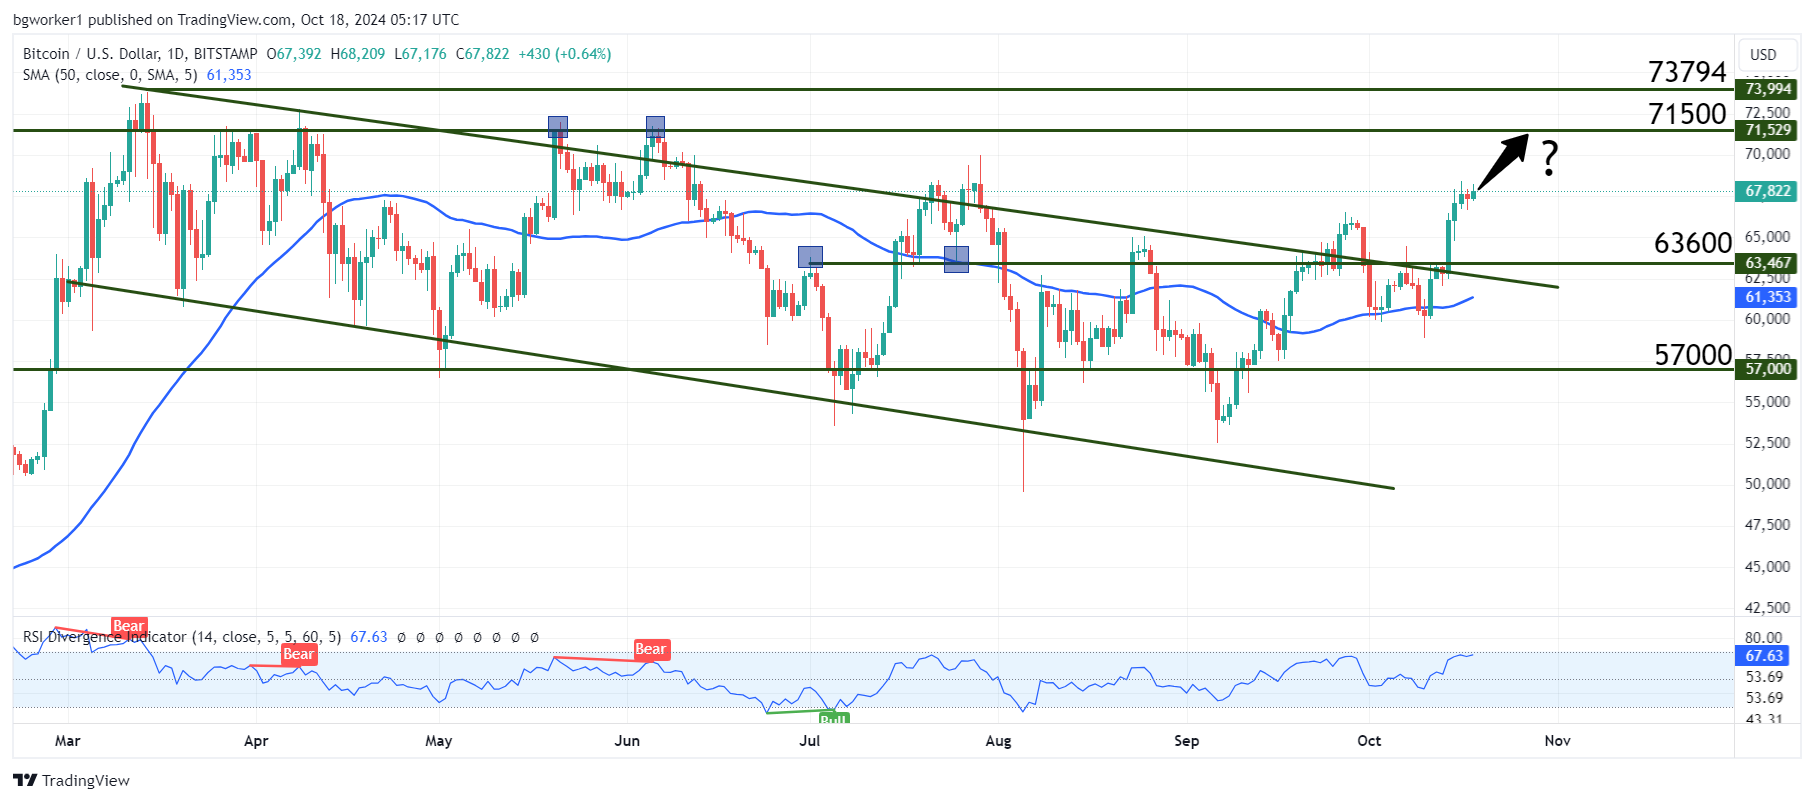
Chart Analysis – BTC/USD
Bitcoin is currently changing hands at $68,100 after a straight climb from $59,000. The move started after a bounce at the 50-day Moving Average and the biggest candle coincided with the break of the long-term descending channel and the resistance at $63,600.
These are very nice conditions for an extended move and not just a brief rally but there’s also a warning sign on the chart: divergence. The RSI is currently at a double top but the price has already printed a higher high – this is known as bearish divergence (although not the strongest kind).
However, if the price continues to climb, the RSI will follow and this means that the RSI will also print a higher high, which will “erase” the divergence we see now on the chart. We can expect to see some retracements when the RSI reaches overbought but the main bias is bullish, aiming for $71,500.