Identifying Support and Resistance Levels from Previous Price History – Part 2
October 24, 2012
I received some questions regarding this post and aim to address them all here.
One question was how many bounces do I look for when considering a level as “valid” or not. The simple answer is that I usually look for at least two bounces. Exceptions might be for recent extremes on the chart (top of the mountain/bottom of the valley) – for instance, high or day (HOD) and low of day (LOD). For S/R within a range, in particular, two prior bounces is definitely preferable (i.e., taking a trade on the third test of the level). However, if price action is supporting a reversal in the form of an extended consolidation zone (three or more bars), I’ll take it on the first bounce (i.e., second test). But I don’t have any mechanical rules, per se. A lot of identifying S/R levels is instinctive to me by just watching how the price behaves around a level.
For example, look at the figure below of a 15-minute USD/CAD chart:

Around the .99473 level, we see old resistance turn into new support and form an extended period of consolidation, which is ripe for put options. For about thirty minutes, price stayed under the level after the re-test, but came back up to test it again only to find further resistance. Later on, we saw more price consolidation around the .99167 level. There was a test of that level around 2AM EST (late Asian session) and it was re-tested again from 4PM-8PM EST. Although technically against the trend of the past half-day, price was holding well enough to consider call options.
When I identify these levels, I do it visually. I won’t mark them on a chart unless I want to set an alert. I usually just go by the 5-minute (5M) chart, though I will often look at the 15M, 30M, 1H, 4H, and 1D. I’m pretty familiar with the 4H and 1D charts since I base my forex trading primarily on those timeframes. Looking at the higher timeframes is very useful when there’s so much choppiness on the 5M that I can’t make sense of what the asset wants to do or have any idea of a valid level that might be the basis for a reversal or general consolidation. I have taken short-term binary trades based on S/R levels as far out as the daily timeframe, but most of the levels that I look at on the 5- and 15-minute charts are less than a day old.
I don’t set a strict limit on how many touches of a level are too many to the point where a breakout might be imminent. For that, you have to look at the price action and nature of the trend. If the candles are displaying more of a range, then that’s an indication that there’s more volume in the market and you might want to err on the side of caution. This is especially important for those who trade around my time (early-to-mid European session) when S/R created during the low volatility of the Asian session are bound to be broken.
The trend is also important. If you’re noticing that a certain price is holding but the retracements off the level are getting continually weaker (e.g., a descending triangle in cases of support; ascending triangle in cases of resistance) then you’re best off just watching the chart rather than taking a risk since your chances of winning are lower. In general, be wary of trading against the trend or momentum. “Short-term” trend (i.e., according to 5-minute or 15-minute chart) is usually more relevant to trading 5-30 minute expiries than “long-term” trend (i.e., according to the 30-minute chart or higher).
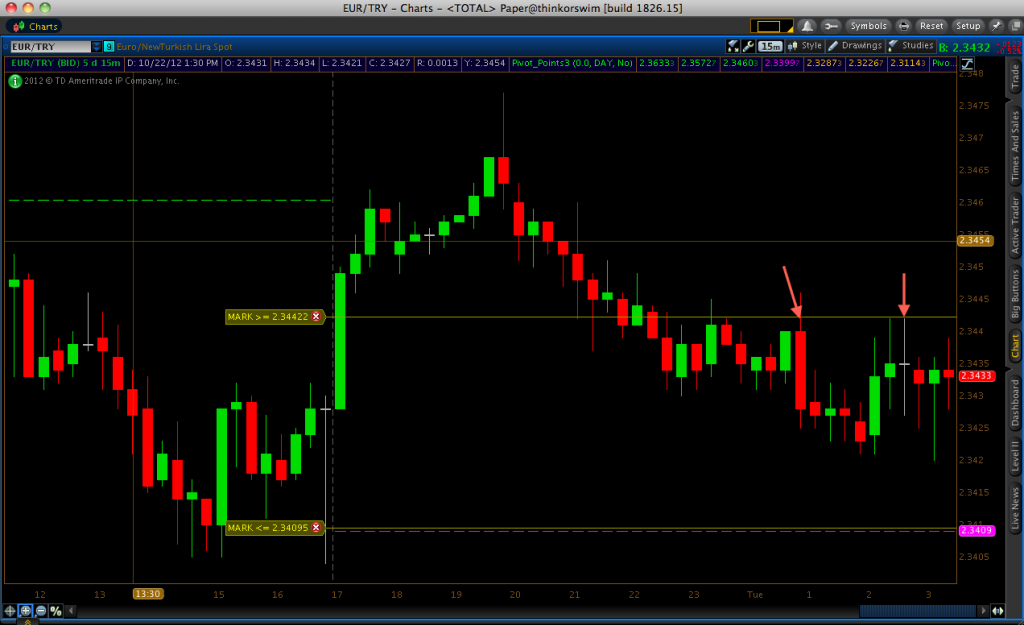
For example, in the case of this 15-minute EUR/TRY chart, although we see some price consolidation between 9PM and 10PM on the chart (between the areas marked as 21 and 22 on the time axis), taking call options at that point would be risky due to the recent downtrending market.

However, just after 11PM we see that the price level estimated at 2.34422 is a solid resistance area and retracements back up to that price level would be viable put option territory. Also note, that S/R levels are often subjective. They’re almost never a price “level,” per se, but rather a zone or general area where price consolidates. Whether you prefer to play it safe and take trades at the top or bottom of wicks or simply at the open or close of previous bars depends on one’s individual risk preferences. While in the case of a resistance zone, taking a trade at the top of a wick will yield a better trade, there’s always the chance that you might miss the trade altogether.