Bitcoin at a Crossroad. Long-Term Trend Line Under Attack
Bullish Divergence in Play. Can Bitcoin Close Above $90K?
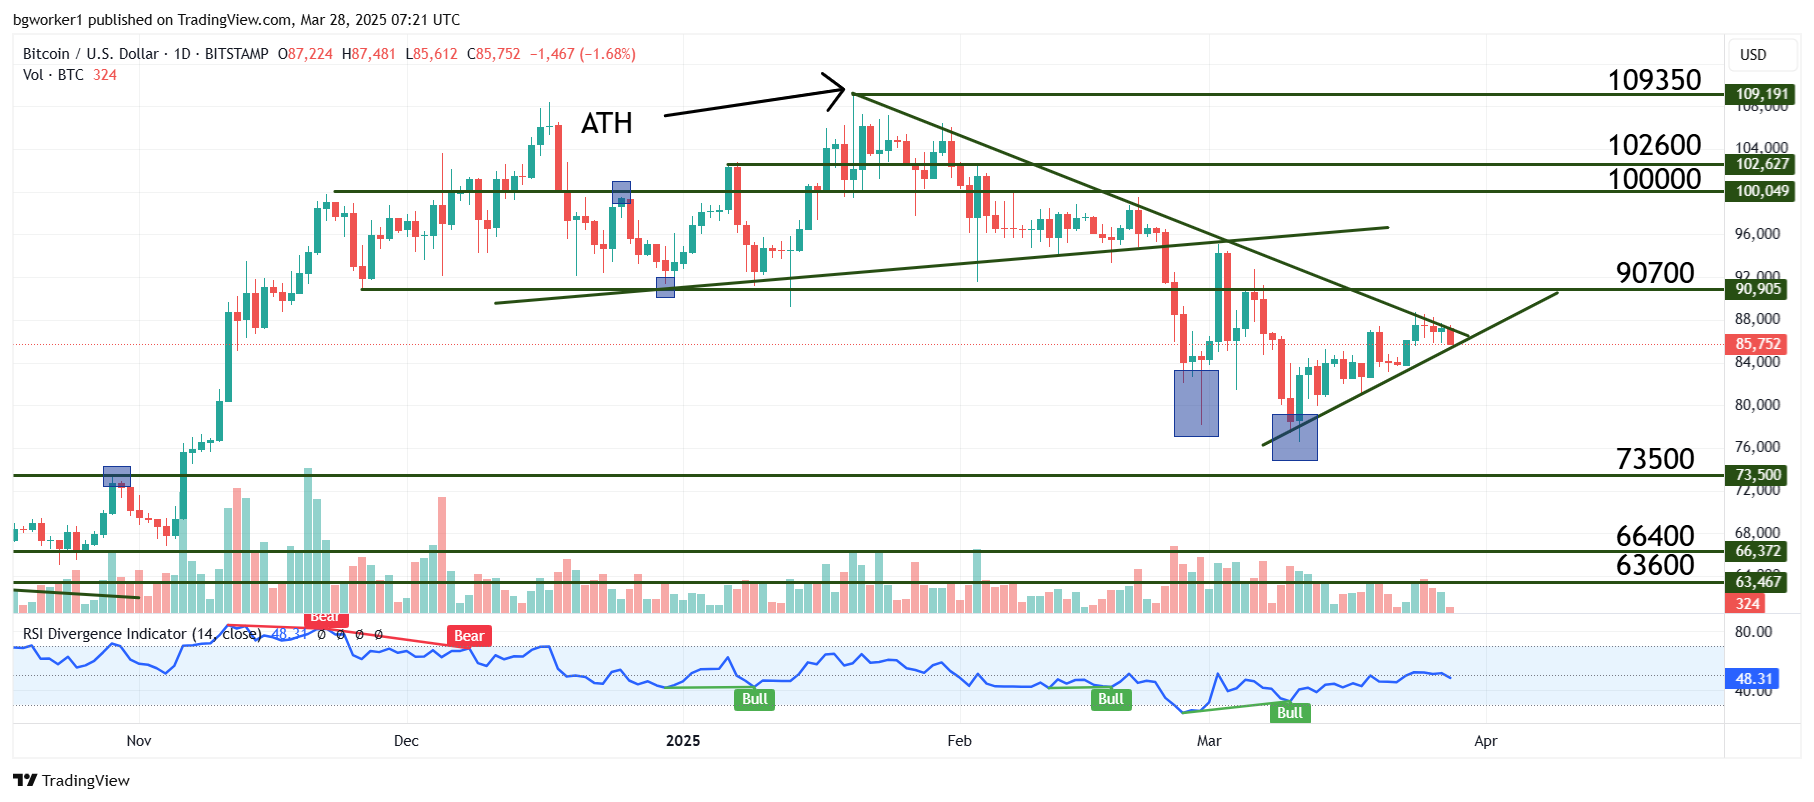
The rally that started on March 11 looked relatively frail right from the start, with small green candles, low volume, and a lack of momentum. The price action looked like a drop waiting to happen right from the start but despite this, Bitcoin slowly climbed higher and higher, reaching the bearish trend line drawn from the All-Time High (ATH).
The bullish trend line drawn from the March 11 low, and the ATH trend line create a triangle, which will probably decide the next medium-term direction. The price is right at the breakout/breakdown point and will inevitably get out of the triangle very soon.
The crypto market has been hit by the uncertainty created by the new tariffs imposed by the Trump administration and fears of a trade war. Also, some of Trump’s pro-crypto actions have not satisfied the crypto masses despite these actions being fundamentally bullish. For example, Trump’s Crypto Summit held at the White House was met with disappointment and so was the Bitcoin Strategic Reserve.
But let’s not forget that a Crypto Summit held at the White House, with the participation of the President of the United States, would have been a crypto lover’s dream a few years ago. A few years ago, mere speculation about an official Bitcoin Reserve would have sent BTC higher. But now, it looks like this is not enough because the Reserve does not include a plan to buy Bitcoin with the taxpayers’ money and the plan is to employ budget-neutral strategies.
Exchange Traded Funds are Back in the Spotlight
Activity in spot Bitcoin ETFs has started to pick up lately and the last 10 days have seen positive inflows, totaling just over $1 billion. Although it’s a positive sign, this amount is modest compared to January 17 when $1 billion was achieved in a day.
Fidelity’s ETF saw net inflows of $97 million on Thursday, while Blackrock’s IBIT registered roughly $4 million in inflows. We are far from a risk-on environment but at least there are some positive signs on the horizon.
Chart Analysis – BTC/USD
The last 2 lows, reached in February and March are showing bullish divergence: the price made lower lows while the RSI made higher lows. This divergence already ignited a rally but now it remains to be seen if the bulls can capitalize on it and stage a breakout.
As already discussed, the bearish trend line is crucial for medium-term price action and a break has the potential to ignite a new uptrend.
On the other hand, we must take into consideration that a break of the bullish trend line drawn from the latest low will bring in additional sellers. Then again, the technical aspect can be easily overshadowed by any macroeconomic developments, which means that we should be aware of false breaks.