Bitcoin Challenges ATH, Fails at Resistance
Ethereum Sees Price Volatility Amid SEC ETF Approval
Earlier this week, Bitcoin reached a high of $71,960, challenging its All-Time High before failing to break the upper side of the descending channel. Currently, Bitcoin is changing hands at $67,000 after a sharp drop, however, many think that there is a lot of room for upside swings.
In a recent post on X (formerly Twitter), crypto analyst ‘CrediBullCrypto’ has forecasted an “ultra bull scenario” for Bitcoin, predicting a potential rally above $80,000 in this market cycle. He also forecasted a surge past $100,000 in this ultra-bull scenario. Then again, considering his X name, such a bullish prediction is somewhat normal.
The Ethereum (ETH) price experienced significant volatility late Thursday following the unexpected approval of spot Ethereum ETFs by the US SEC. This decision marked a dramatic shift in market expectations, as many had anticipated rejection.
The Ethereum price was trading around $3,800, down from earlier session highs near $4,000 but up from lows of $3,520. Over the last 7 days, Ethereum is up 22.45%, driven by rumors of a possible SEC u-turn that began on Monday. This speculation led to increased engagement between ETF issuers and the SEC, culminating in the approval of eight spot Ethereum ETFs on Thursday.
The approval of these ETFs is significant as it paves the way for institutional investors to enter the Ethereum market, potentially driving up the price. Let’s not forget Bitcoin’s surge to record highs following spot Bitcoin ETF approvals earlier this year. That being said, Ethereum could soon experience a similar upward trajectory.
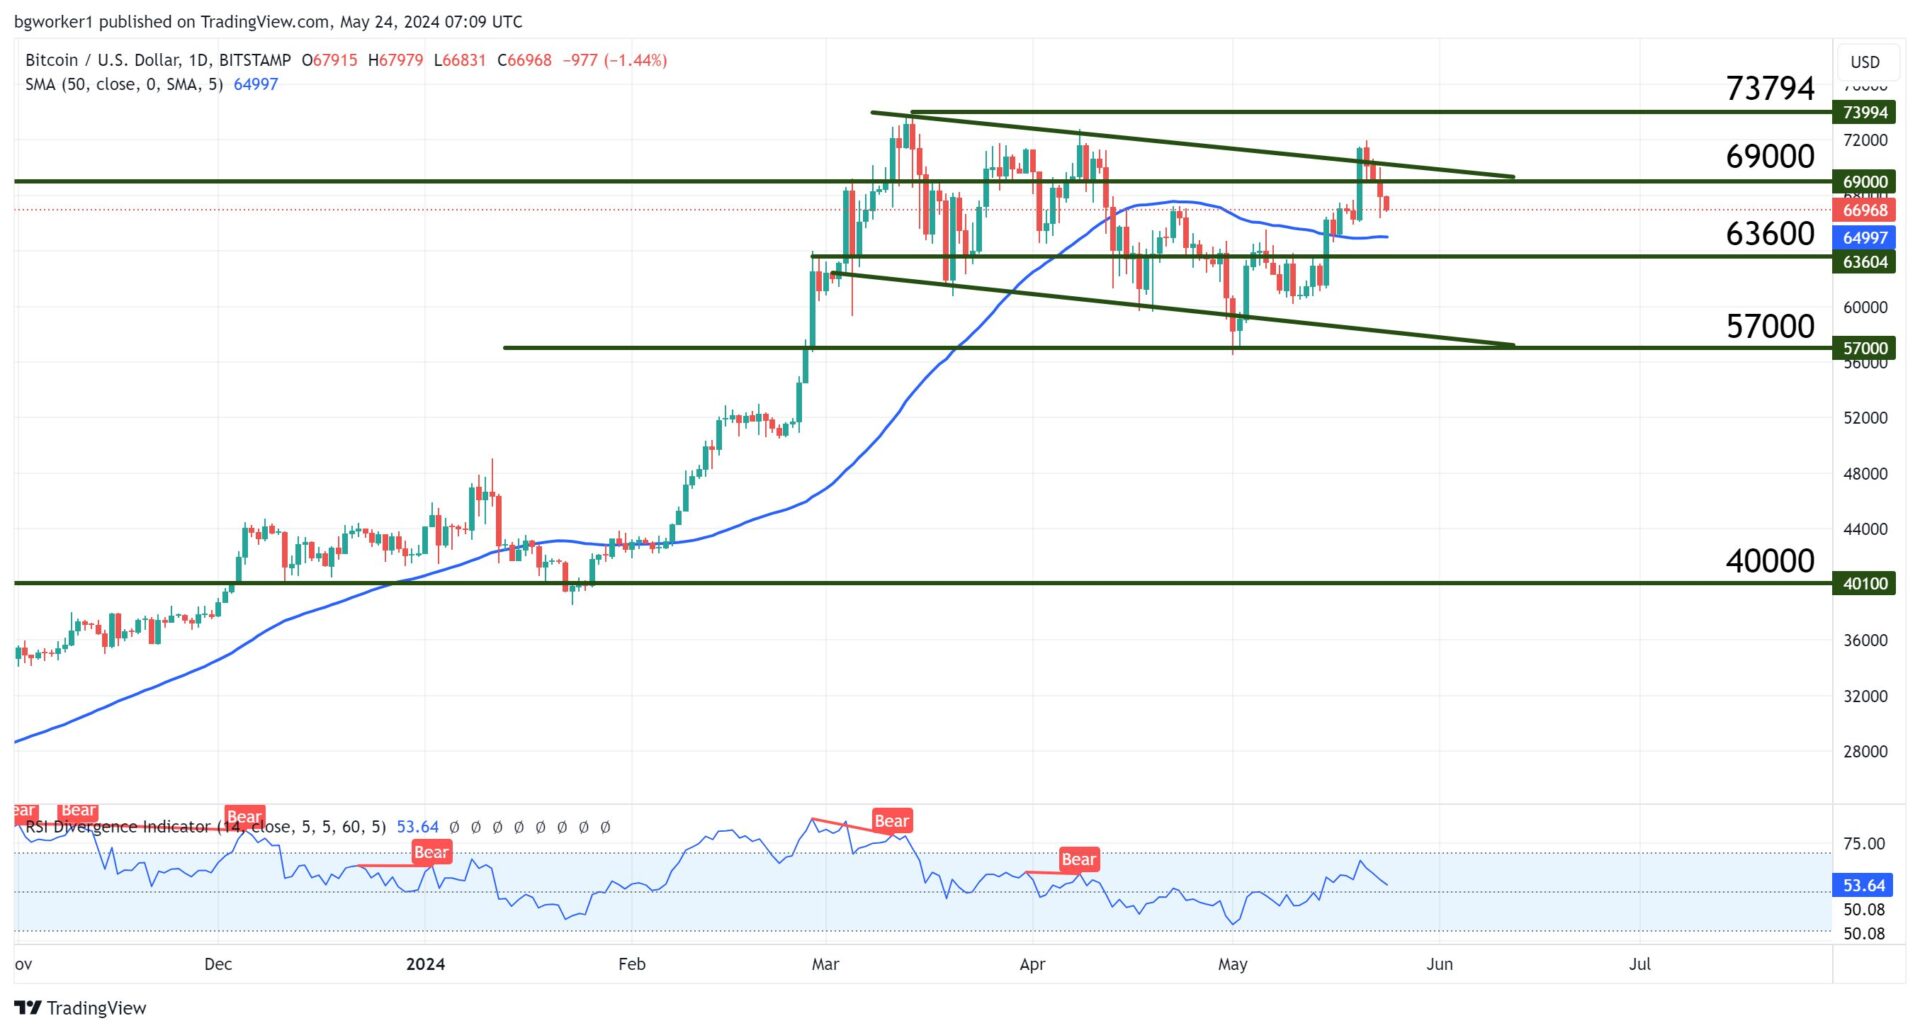
Chart Analysis – BTC/USD
Over the last few weeks, Bitcoin respected the boundaries of the descending channel almost to the T. In early May it touched the lower boundary and bounced swiftly after a false break; this price action also established $57,000 as a notable suport level.
Earlier this week, the strength of the channel came into play once again and reversed a strong move that saw Bitcoin reach a high of $71,960. This false break sent BTC/USD below the support/resistance level at $69,000.
The current pullback may find support on the 50-day Moving Average and afterward, we may see another attempt to break the upper boundary of the channel. If this happens, there’s a high chance that we will see a new All Time High very soon. If the bulls don’t step in relatively quickly, Bitcoin is in for a rough time, with chopiness ahead.