Bitcoin Crashes Below $80K. “Buy The Dip” Hype Kicks In?
BTC/USD: RSI Enters Oversold on a Daily Chart. More Pain Before Pullback?
Bitcoin bulls are licking their wounds as the King of Crypto is tumbling below $80K, breaking major support levels and trend lines in the process. Most of this is a result of President Trump’s new tariffs and increasing fears of an economic trade war between the U.S. and other countries.
Earlier this week, Donald Trump iterated that the Mexican and Canadian goods will be hit with 25% tariffs and this will come into effect on March 4. Goods from China will be taxed an additional 10% and the President also warned that some extra duties may be imposed on European goods.
For more than a decade, Bitcoin has been considered a hedge against uncertainty but it looks like something has changed. Maybe the institutional interest that has been growing since the introduction of spot Bitcoin ETFs is affecting its ability to withstand periods of turbulence.
According to data from CoinGlass, more than 200.000 traders have been liquidated over the last 24 hours, amounting to $800 billion. Out of all liquidations, about 86% have been long positions. The largest liquidation was recorded on the HTX exchange: a whopping $38 million.
What’s next: Pre-Election prices or bounce?
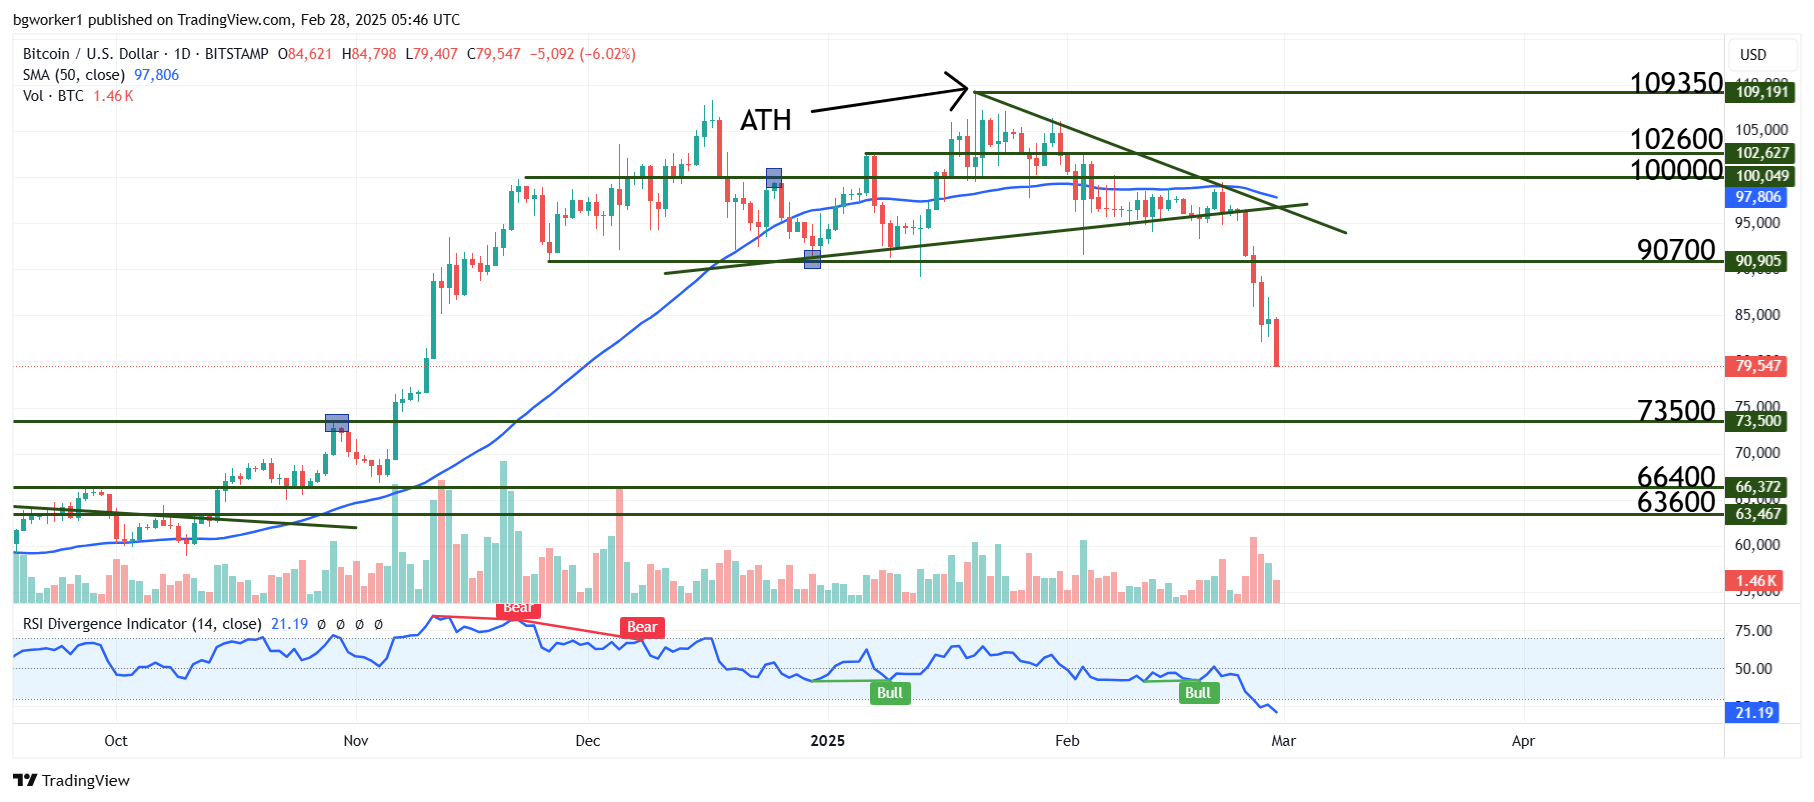
The current price level is close to the Trump Presidential win on November 5, when Bitcoin and most other cryptocurrencies got a massive boost. That ultimately led to the current All-Time High (ATH) for Bitcoin, just a few hundred dollars shy of $110K.
Despite the recent crash, social media is buzzing with “buy the dip” mentions, according to data from on-chain analytics firm Santiment. In a post on X made on February 28, the firm said that discussions on social platforms are “showing a very high level of confidence”. The same post also mentioned that this is the highest crypto dip buying hype in 7 months. However, just buying interest on social media platforms is not enough to say that a bounce is starting right now. But it is in the works.
Chart Analysis – BTC/USD
At the time of writing, Bitcoin is trading at $78,900 and it looks to be headed even lower before a bounce will happen. Just how bullish moves are corrected, drops like the current one will recover, at least partially initially.
The RSI has entered oversold on a Daily chart, which is normal after such a drop but it is also an indication that bullish pressure is starting to mount. The overextension of price will not go unnoticed by trading bots and institutional investors, however, the exact moment of the bounce is harder to anticipate.
The closest important support is located at $73,500, which was an ATH a year ago, in March 2024, and most recently, it was the breakout price on November 5 at the time of the Presidential Election. It’s quite a big distance for Bitcoin to cover in one go while being oversold, so maybe we will see a bounce before that level is reached.