Bitcoin in the Boredom Zone: Waiting for the Next Big Move
Chart Analysis Suggests Key Support Levels as Mt. Gox Payout Looms.
Right now, Bitcoin is stuck in what many analysts call the “boredom zone,” with prices showing slow movement and low volatility. Hovering around $68,000, Bitcoin hasn’t seen any major spikes or dips in the past month, reflecting a period of relative calm. It seems the market is waiting for a spark—whether it’s a regulatory change, economic news, or a tech breakthrough—to shake things up.
However, we could argue that the move from the bottom of the descending channel (around $57,000) to the upper boundary of the channel (around $71,000) was significant. On the other hand, it can still be considered trading in a range because the channel pattern was not broken.
Mt. Gox: Shaking Things Up?
Mt. Gox, the infamous Bitcoin exchange that collapsed in 2014, has recently started paying back its creditors. On May 27th, a significant chunk of Bitcoin, worth about $9.4 billion, was released, raising concerns about what this influx could do to market liquidity and stability.
CryptoQuant, a market analysis firm, noted that 138,000 Bitcoin moved from Mt. Gox in seven transactions to Mt. Gox’s Rehabilitation Trustee. These funds are all under the control of Mt. Gox’s Rehabilitation Trustee and so far, no actual repayments to creditors have happened, but preparations are clearly underway.
These internal transfers haven’t hit the market yet, so there’s no immediate impact. However, they are expected to be completed by October 31, 2024, and could release a lot of Bitcoin into the market, potentially affecting liquidity and price stability.
Of course, it all depends on how those creditors see things. After all, they could decide to hold on to their BTC, anticipating higher prices. Or they may be fed up with the 10 years of waiting and simply decide to get rid of it all, cashing out. For now, though, there’s no selling pressure since the BTC remains in Trustee-controlled addresses and isn’t yet available on the open market.
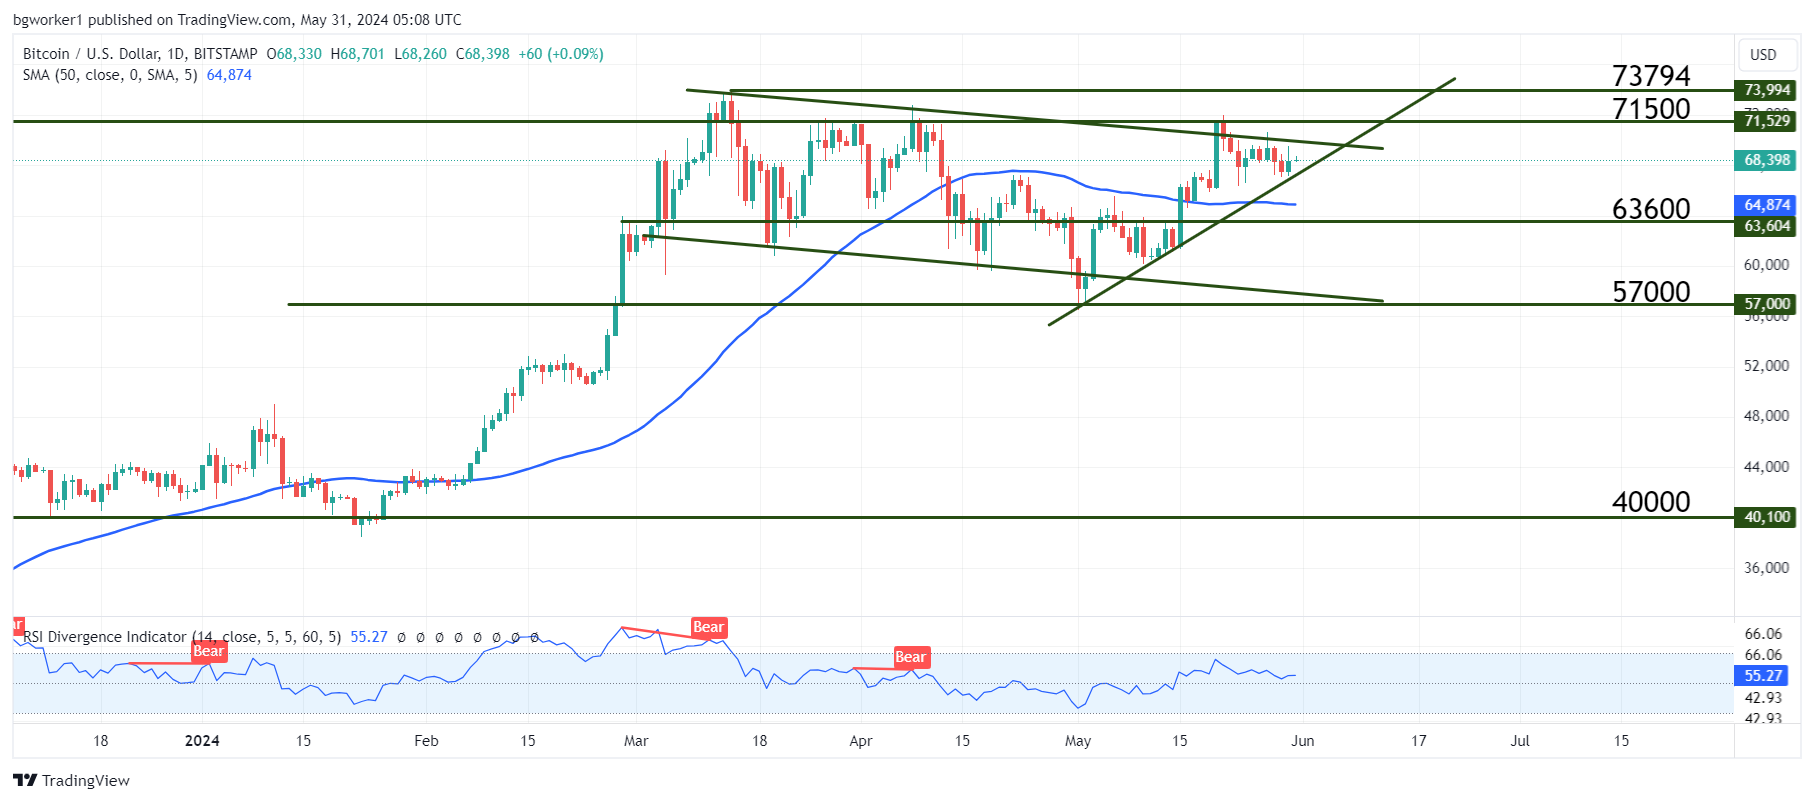
Chart Analysis – BTC/USD
Bitcoin is currently changing hands at $68,400 and is up 1.23% over the last 7 days. We have seen two false breaks in the recent period – at the bottom of the descending channel and at the top of it.
After the bounce at the lower part of the channel, Bitcoin rose to the top of the pattern and now it shows rejection off the upper boundary. This means that it could slip lower toward the bottom of the channel. But the bullish trend line seen on the chart below may offer some support and ignite a rally.
If the trend line is broken, BTC will meet support at the 50-day Moving Average. If that barrier is broken, we can expect to see a bigger dip, maybe in the $60,000 area. On the other hand, a bounce at the trend line would mean that Bitcoin bulls are ready to challenge the ATH.