Bitcoin Nears ATH: Economic Data Could Be Key
Double Top or Breakout? Today’s NFP May Hold the Answer.
Bitcoin started the week on a positive note, with wind in its sales and a fresh challenge of the resistance at $71,500 after a bounce off the bullish trend line.
And since we are close to the All-Time High, the question arises: can Bitcoin reach a new ATH if U.S. employment and inflation indicators show signs of slowing? Job creation is tightly correlated with inflation and if both tone down, the Fed may reconsider the rate cut timing.
We are still waiting for the key Non-Farm Payrolls report to come out later today but on Tuesday, the JOLTS job openings dropped to 8.06 million, the lowest in three years. On Wednesday, the ADP Non-Farm Employment Change report also came out below expectations. This could signal an economic slowdown and lower inflation. Thus, if today’s NFP is lower than expected, the impact may be bullish for BTC.
Next week the Consumer Price Index (CPI) is scheduled for release and if it decreases by at least another 0.1%, it could trigger a Bitcoin price surge. On May 15 the CPI decreased by 0.1% and that triggered a 7% increase in the price of Bitcoin over the next 7 days. It may have the same effect this time or it may not but a significant CPI drop is expected to prompt rate cuts, potentially pushing Bitcoin to new highs.
ETF Inflows Are Swelling
After a period of cool down and outflows, it looks like the spot Bitcoin ETFs are getting their swagger back. On Tuesday they saw a combined $880 million in inflows and Bitcoin rose to over $71,000, a 3% increase in 24 hours.
The push was led by Fidelity’s FBTC with $378 million inflows, followed by BlackRock’s IBIT with $270 million. The ARK 21Shares Bitcoin ETF also saw $139 million in inflows and Grayscale’s GBTC saw $28 million.
This marks the highest single-day inflow since March. Bloomberg analyst Eric Balchunas noted that ETFs accumulated $3.3 billion in the past four weeks, which brings the total for this year to over $15 billion. This trend of consistent inflows over 16 days indicates strong investor interest and confidence in Bitcoin ETFs, despite previous outflows in April. But then again, fluctuations are normal as is a switch between inflows and outflows.
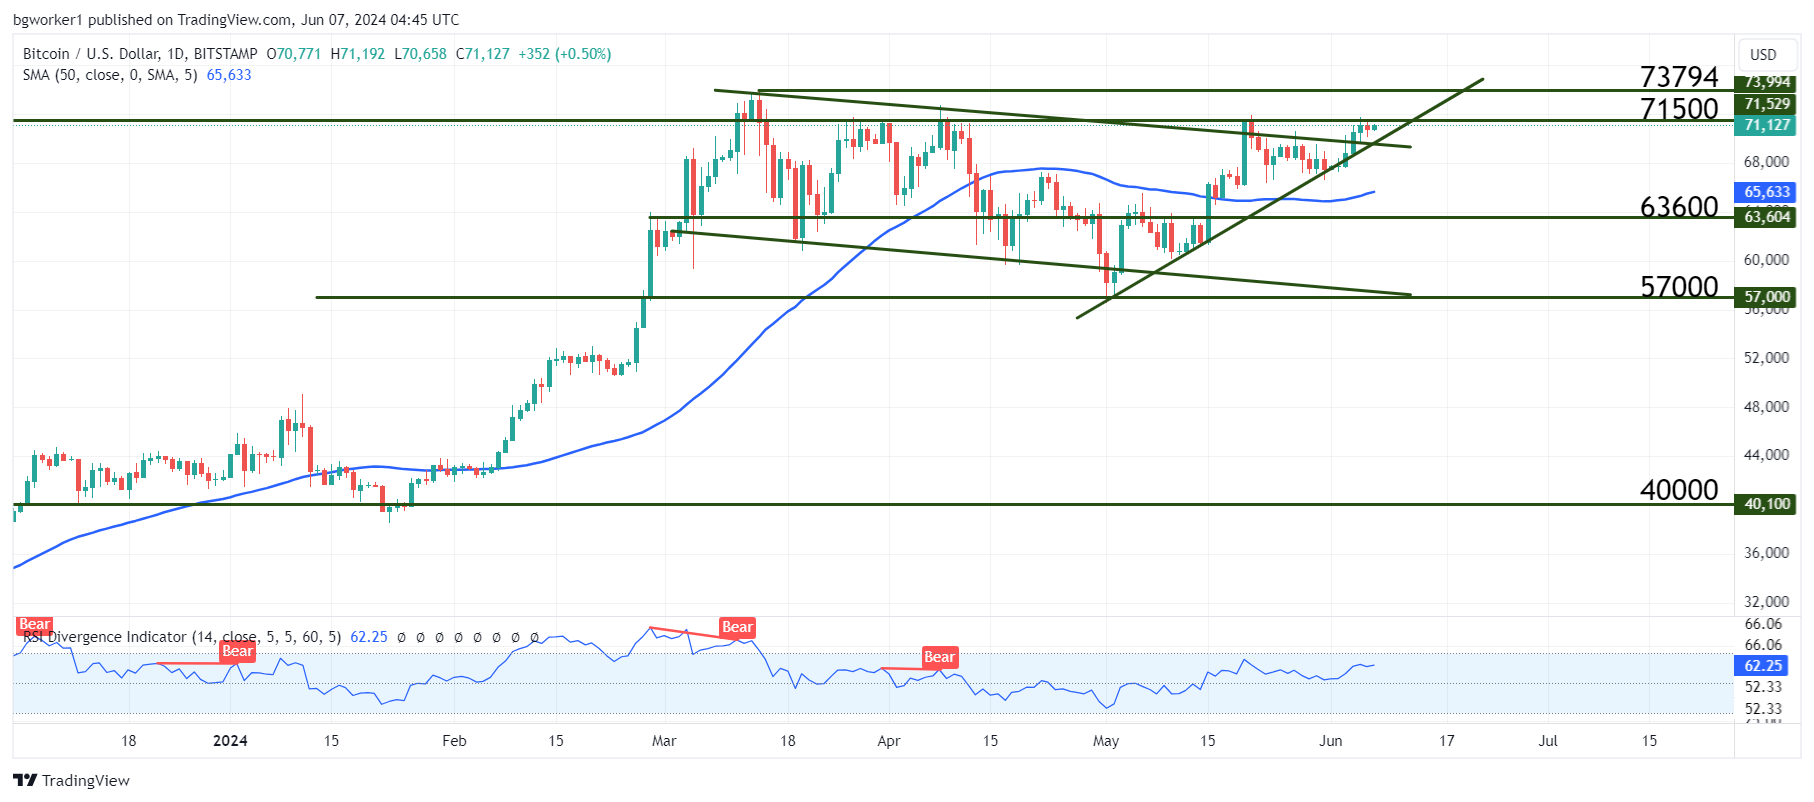
Chart Analysis – BTC/USD
The resistance at $71,500 is not broken, which is an important development for medium-term price action. Currently, we are seeing a double top, which is a very bearish pattern but this is the third day that Bitcoin is touching this price point and attempting to break it. In other words, it may very well move past $71,500 and then we won’t be dealing with a double top anymore.
The bounce at the trend line followed by the break of the descending channel and a potential break of $71,500 resistance can mean only one thing: the All Time High is going to be challenged. If it’s broken, then $75,000 is next, and depending on the NFP and the CPI that’s due next week, we may see $80,000.