Bitcoin’s Extended Lull: Getting Ready for a Big Move?
Bullish Signs Ahead: Whales Are Loading Up, Exchange Supply Goes Down.
Bitcoin has been consolidating for more than 90 days now, which is its longest period of such price action and could be a precursor to a significant upward rally. Usually, the longer the consolidation, the bigger the explosion is when the price finally breaks out or breaks down.
A similar pattern was observed in previous cycles. For example, after the 2020 Bitcoin halving, there was a shorter consolidation period before Bitcoin went ‘to the Moon’, eventually reaching an all-time high of $69,000 in November 2021.
Currently, Bitcoin has been in a consolidation phase since hitting its all-time high of $73,794 on March 14. During this period, Bitcoin’s trading volume and volatility have been lower than usual. It has traded within a relatively tight 23% range, briefly dipping to its lowest point of $56,500 on May 1. As of now, Bitcoin is trading at $66,830, according to CoinMarketCap, and has dropped 6.31% in the last 7 days.
Whales Are Out Hunting
In addition to this consolidation phase, Bitcoin whales have been actively accumulating. Earlier this week, on June 11, whales bagged a combined 20,600 BTC, worth $1.38 billion amid a market correction.
According to on-chain analysis company CryptoQuant, this was the largest single-day inflow for Bitcoin whales since February 28. Most of the time, when whales accumulate, it means that a rally will soon follow.
This whale activity also coincides with a decline in Bitcoin reserves on crypto exchanges, which have fallen to 942,000 — their lowest level since December 2021, according to blockchain data platform Santiment.
A decrease in Bitcoin reserves on exchanges often indicates a bullish sentiment among investors, who anticipate upward price movements in the mid to long-term. In scenarios like this, they take their coins out of exchanges and keep them in their personal, secure wallets. The coins move back to the exchange when the investor looks to sell.
In summary, we have a prolonged consolidation phase, whales are accumulating, and exchange supplies are dropping. This points towards a potentially strong upward rally in the near future but at this time, the charts show points of resistance.
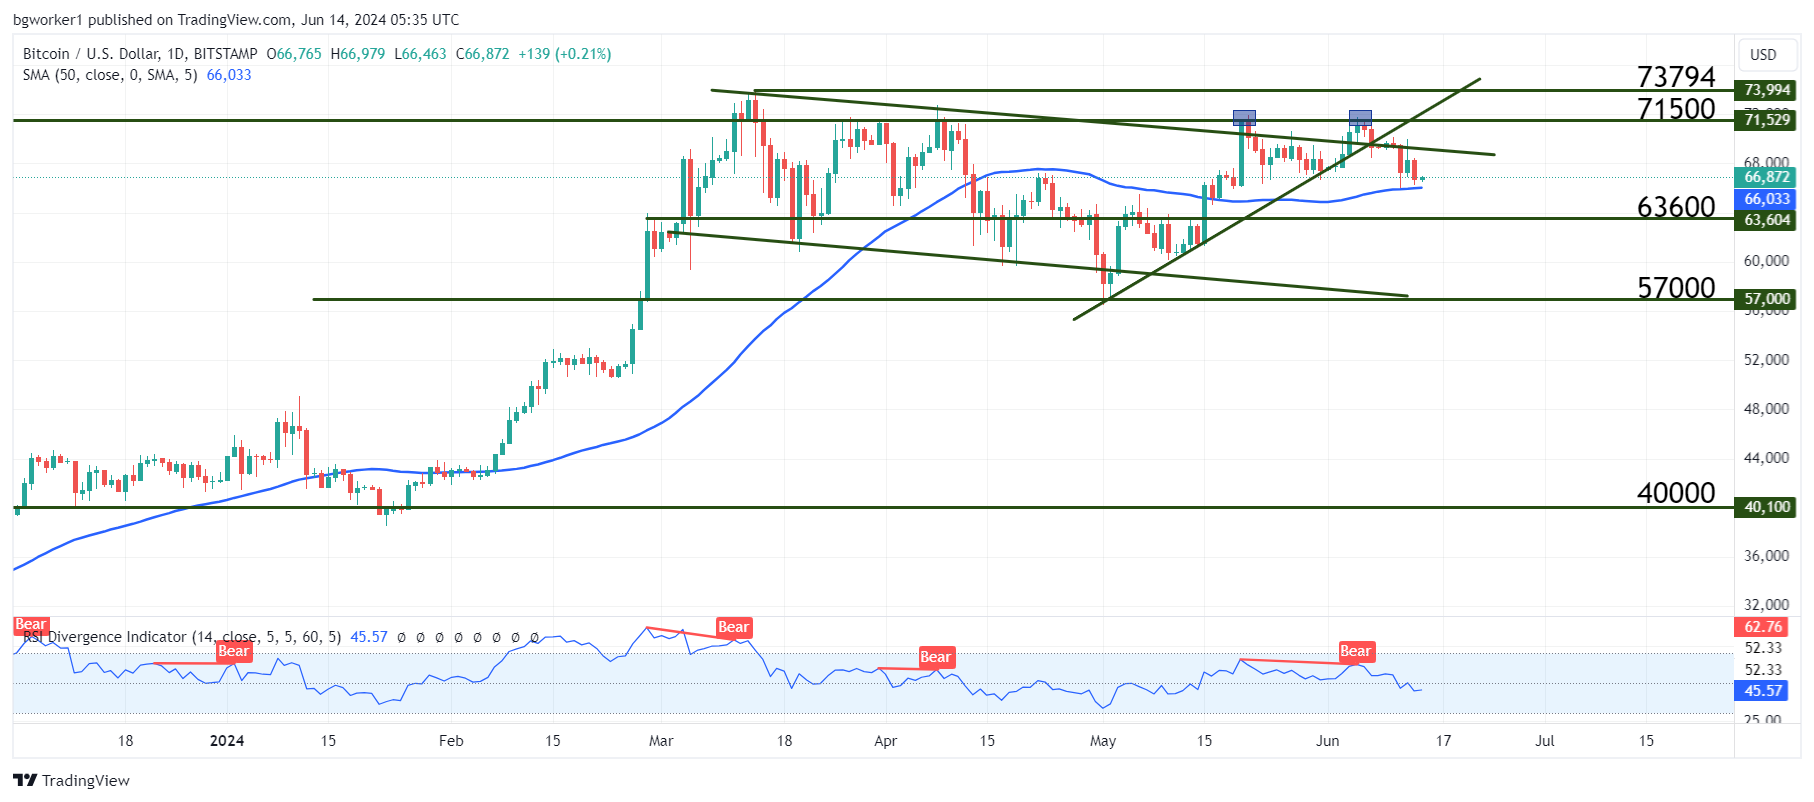
Chart Analysis – BTC/USD
Bitcoin bulls recently failed twice to break the resistance at $71,500, creating a double top, which is a strong bearish signal. Moreover, after the second touch of resistance, the pair dropped back into the descending channel. This return inside the channel could suggest that the next destination is the lower part of the said channel, around $57,000.
That may be a too pessimistic scenario because we still have support around the 50-day Moving Average and on Tuesday, Bitcoin touched the 50 MA, resulting in a bounce higher.
Here are the things that must be closely watched: the upper line of the bearish channel, the resistance at $71,500, and the 50 MA. If the bulls can quickly and convincingly break the former two, we are looking at a potential rejuvenation of the uptrend. If the 50 MA is broken, the consolidation will continue, with a bearish bias.