Bitcoin’s Wild June: German BTC Sales and Inflation Impact
The Double Top at Work: Will BTC/USD Reach the Bottom of the Channel?
This month, Bitcoin’s price has fluctuated wildly: after nearing $72,000, close to its all-time high from March, it retreated to the $58,000 area. Just Monday, BTC dropped from $63,100 to $58,500 before erasing some of the losses and closing the session at $60,250. This drop could be attributed to significant on-chain activity related to the German government’s Bitcoin holdings.
According to Lookonchain, Germany, the Eurozone’s largest economy, transferred 750 BTC (worth over $46 million), sending 250 BTC to crypto exchanges Bitstamp and Kraken. This move, which is part of a broader divestment strategy of seized Bitcoin, signals potential selling intentions and adds bearish pressure to the market. Currently, the government holds over 45,000 BTC.
Ethereum (ETH) mirrored Bitcoin’s downward trend and we may see more volatility ahead, with the upcoming release of the Federal Reserve’s preferred inflation gauge, the core Personal Consumption Expenditures (PCE) price index. Economists, as per Bloomberg, predict a tiny change for the core version of the PCE: from the previous 0.2% to 0.1%. The headline figure of the PCE is not expected to change at all. This would translate to 2.6% annual increases in both headline and core figures.
A report showing that inflation is cooling down could increase the chances of a rate cut in September, which would potentially stabilize BTC prices or even send them higher.
Chart Analysis – BTC/USD
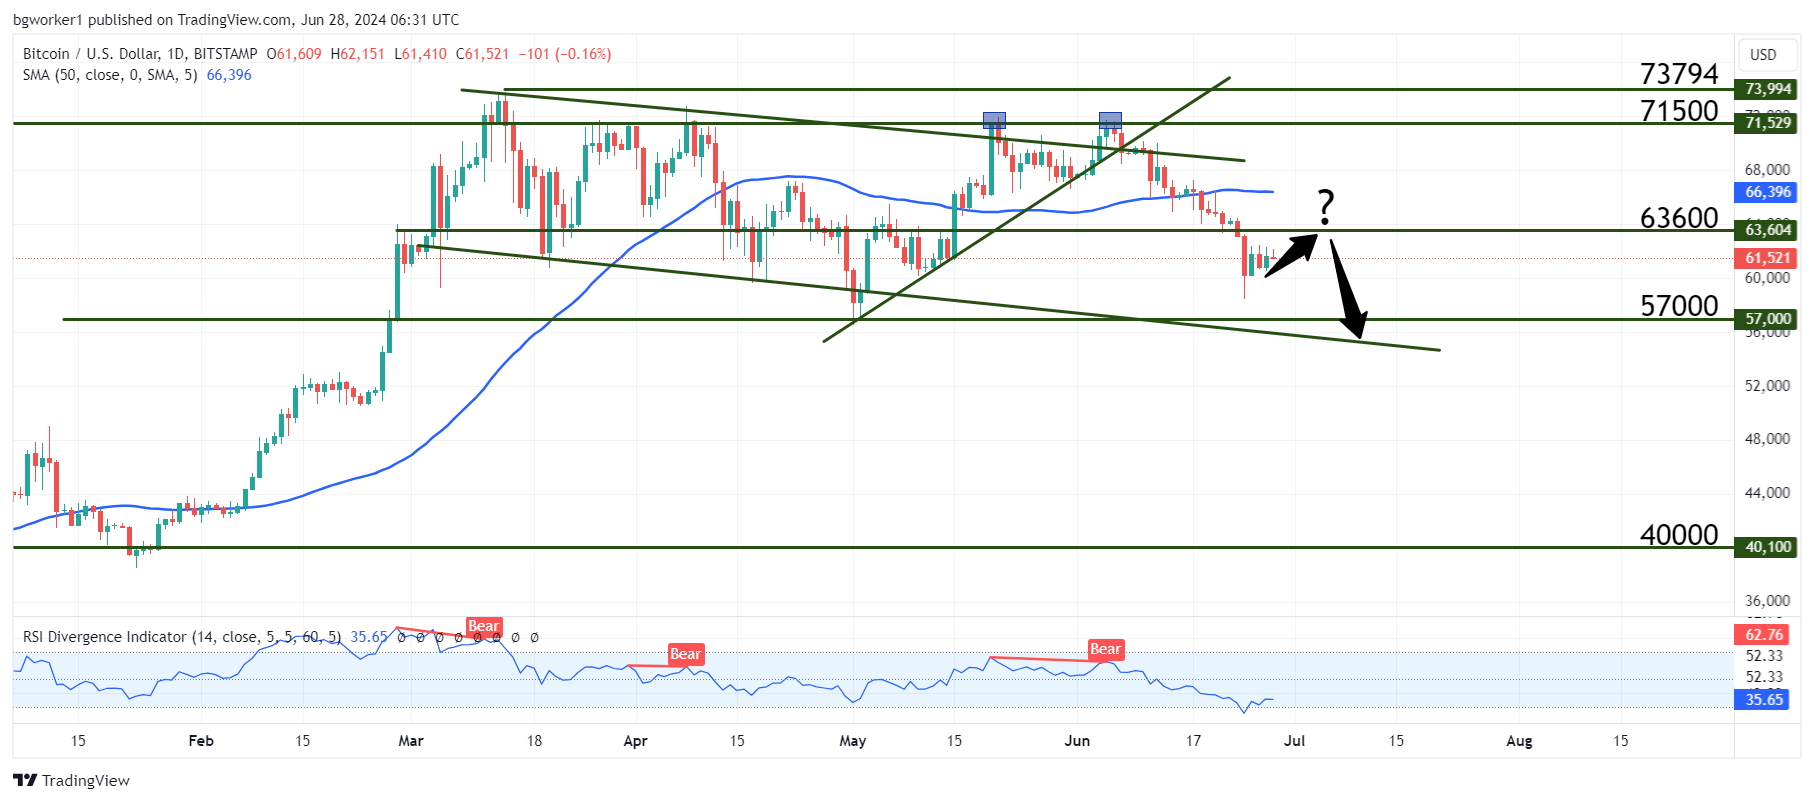
In late May and early June, the price action has formed a double top pattern, a bearish signal comprising two peaks with a valley in between, indicating potential uptrend exhaustion. We’ve talked before about this pattern and, in fact, we can already see it at work: after the double top and the breach of the low between the peaks, Bitcoin dropped significantly and looks to be headed towards the bottom side of the descending channel.
This channel has been playing an important role since its creation and although it appeared to be broken several times, the price returned inside it and continued to travel to the opposite side. It looks like currently, the pair is in the process of completing yet another journey from a false breakout to the opposite side of the channel. If this is indeed the case, we will probably see a break of the $57,000 support and a move into $55,000.
However, there’s an important indicator that should not be overlooked: the RSI. Notably, the RSI reached an oversold position during Monday’s drop. The last time the RSI was oversold was in August 2023, so this current position may significantly impact the price action. This could potentially drive Bitcoin higher, possibly reaching the $63,600 area, where it will face a ‘bounce-or-break’ scenario.