Closing out the Week with Two More Solid Trades
August 15, 2014
Another day of trading the GBP/JPY. The EUR/USD is my standby as I’ve mentioned, but changing things up a bit from time to time (as in trading a different, but not totally different, asset) can be okay. Monotony is trading is actually a good thing to some degree in that repeating the same thing over and over again successfully helps to establish consistency. And monotony itself also helps to tame trading emotions that can prove to be so ruinous to one’s account and personal self-confidence.
1. I first had the pivot level of 170.985 targeted for call options as the market went into a downtrend to begin the morning. This level also had the 171.000 whole number going for it. I take an approach toward trading that believes in the importance of confluence when it comes to trade set-ups. That is, the more you have going in your favor in a trade the better. If a price level involves a pivot point in addition to a whole number, that will likely be a more robust support or resistance level than just the pivot point alone.
However, 170.985 never came into play and the market reversed just before the whole number. It was at 171.250 where price ran into resistance. Wicks started forming in the area and after the fourth wick at this price, I drew in a resistance level (but adjusted it a couple tenths of a pip higher on the next candle) and began considering 171.250 for put options.
The 5:25 candle formed a doji for the sixth rejection of that level in the past seven five-minute candles. When the 5:30 candle did the same and moved down from 171.250 by a few pips, I was fully confident in this level as a trade set-up. The move down on the 5:30 helped show that selling had some strength at this level. Once 171.250 was re-touched on the 5:35 candle, I got into the put option.
This trade did go against me on the 5:40 candle, closing above 171.250 and moving over three pips out of favor at one point. By I was fortunate enough to get a nice red closing candle that moved down seven pips, below my entry point, and closed out in-the-money by about four pips.
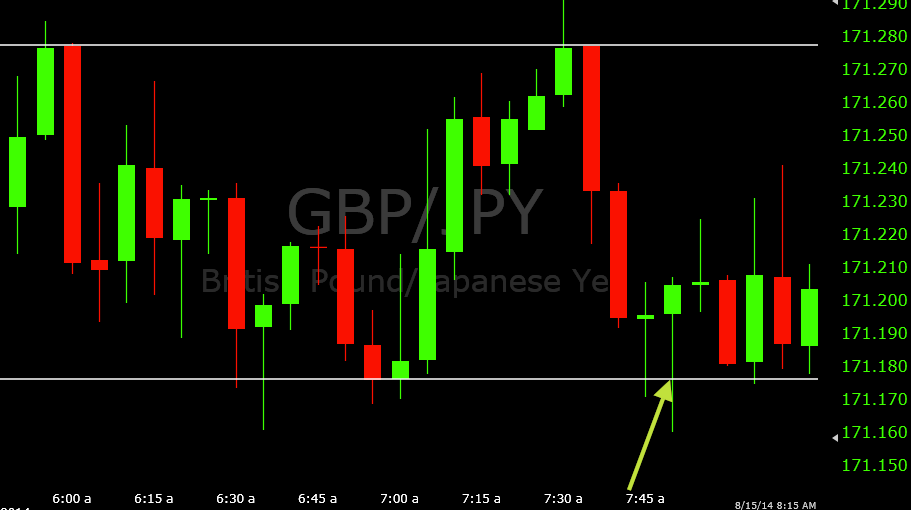
2. Following this, a level of resistance was established at 171.278 and a level of support formed below at 171.177. No pivot points were used in these determinations, of course; just the price history. It’s almost a habit in my trading to keep track of daily highs and lows and also any support or resistance of note that has recently occurred. Oftentimes I never use them, but I simply find it helpful to mark them off with lines.
Upon the re-test of 171.278, I was looking for more of a clearer rejection of that level. The market closed at the level and promptly began falling on the following candle. So no trade taken here.
3. 171.177 was tested shortly after the 171.278 trade failed to materialize according to my personal trading preferences. The 7:45 candle bounced sharply off 171.177. Obviously, this is the result that I want in order to support the notion of 171.177 holding and having a level of robustness to support a trade set-up.
When price came down to re-touch 171.177 on the 7:50 candle, I took a call option on the touch of the level for an 8AM expiry.
This trade was five pips in favor at one point. But like any binary options trade, it’s never over until it actually is. It never went out of favor, but by the end I won by just a mere half of one pip.
This turned into an exceptional week, and one of the very few weeks during the years in which I trade all five days consecutively. Overall, I had 10/11 ITM, which of course isn’t sustainable by any means and is a statistical blip in much the same way a 5/11 ITM week might be for me. But with good set-ups, good things will happen.


