ETFs Back in the Spotlight – $366M Pours Into the Market
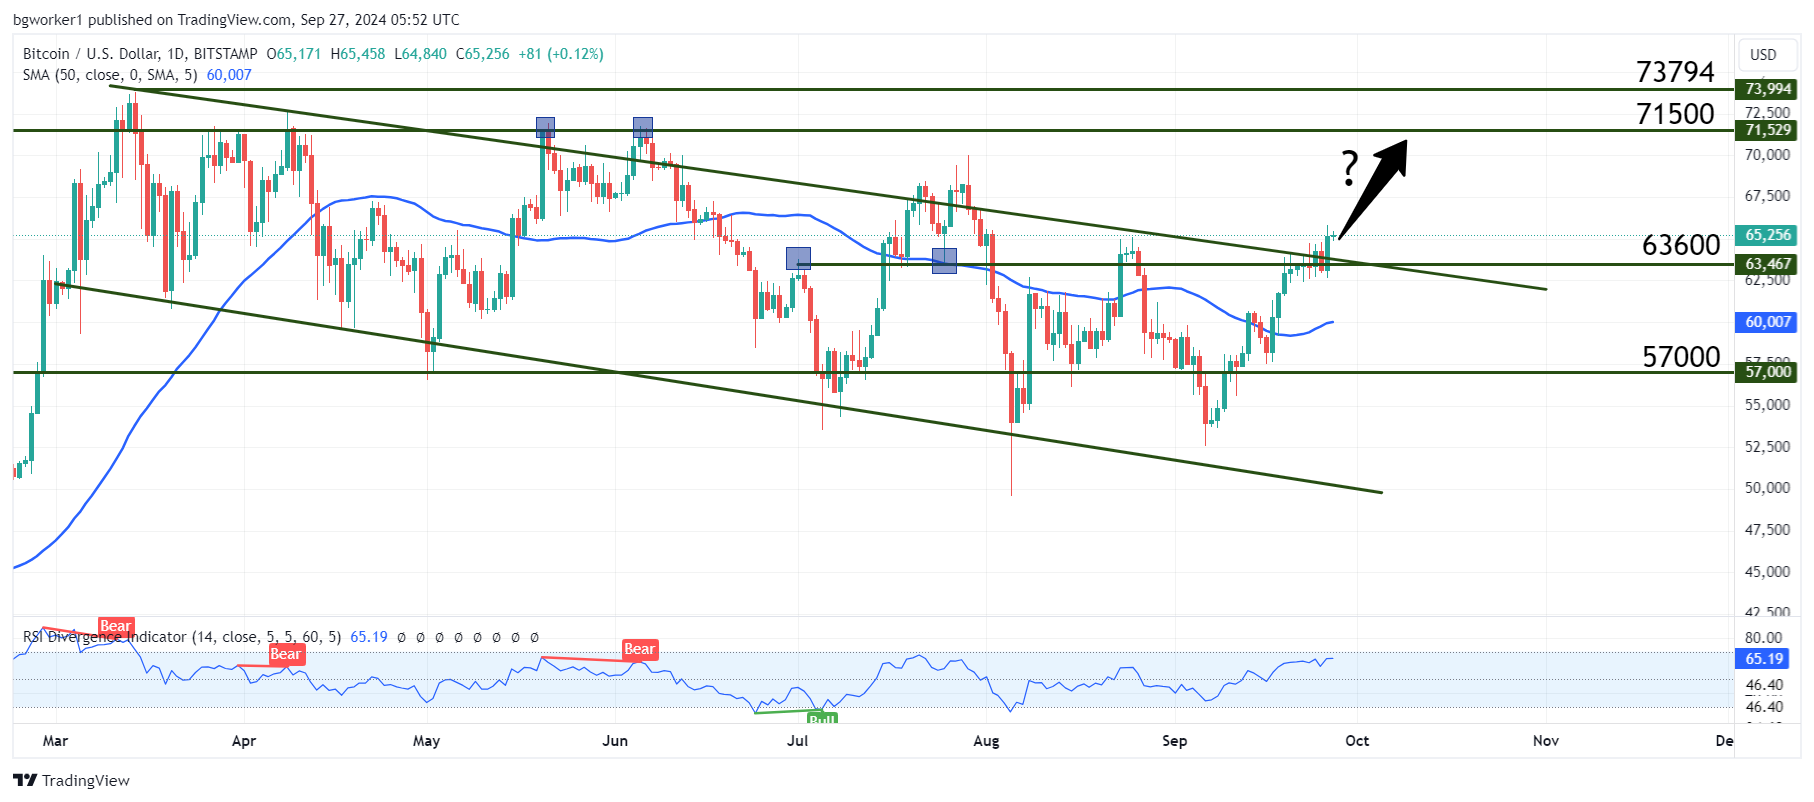
Is Bitcoin Finally Free of the Descending Channel? Where to Next?
On September 26, spot Bitcoin Exchange Traded Funds (ETF) have seen the largest inflow since July 22nd. This happened just as Bitcoin broke through the $65,000 barrier and possibly managed to finally break free of the descending channel.
On September 26, Bitcoin had a massive bullish day, climbing from a low of $62,700 to as high as $65,850 and closing the day at $65,175. This coincided with massive inflows for almost all spot Bitcoin ETFs.
The total inflows amounted to $365.7 million and the leaders of the pack were Ark’s ETF with $113 million, followed By BlackRock’s IBIT with $93.4 million. It’s worth noting that BlackRock’s ETF produced inflows of $184 million just a day prior, on September 25th.
Other notable inflows were brought in by Fidelity’s FBTC with $74 million, Bitwise with around $50 million, and VanEck with $22 million.
The only outflow for the day was recorded by Grayscale’s Bitcoin Trust, which registered $7.7 million of outgoing funds.
The total inflows since the inception of the spot Bitcoin ETFs back in January have now reached $18.3 billion (this is the aggregate sum for all 11 spot BTC exchange-traded funds).
On the other hand, Ethereum ETFs are not doing so great. On Thursday, nine funds saw outflows of $100K, while Grayscale’s Ethereum Trust registered $36 million in outflows the same day. Fidelity and BlackRock both registered more than $15 million in inflows during the same day.
Chart Analysis – BTC/USD
Bitcoin is once again out of the descending channel but looking at the chart below, the upper barrier of the channel generated more false breaks than the lower side. Each time BTC/USD touched the lower barrier, it produced an immediate reaction and large rejection candles with long wicks and small bodies.
Also, the bullish move that followed was fast and strong. Now, taking a look at the false breaks of the top line, we can see that the price made more than one attempt to break out. In other words, it moved above the line, came back, and then tried again, creating double tops.
This behavior shows that the bullish pressure at the top line is higher than the bearish pressure at the bottom line. But it also cautions us that we may still be dealing with a false break.
It’s important to note that the price broke through the resistance at $63,600, which created a confluence zone together with the top line of the descending channel. Usually, the break of a confluence zone is a sign of strength from either bulls or bears (in this case, bulls).
If we are dealing with a true break, the first target will be the top at $68,500, where we will likely see a pullback.