Exploiting the Same Price Level more than Once and Making the Most of Limited Opportunities
August 25, 2014
Monday was one of those trading days where there’s a decent amount of movement, yet not much going in the way of actual trade set-ups. Pivot points weren’t a factor and it took a price level to manifest on its own from the price data to actually get something worth trading.
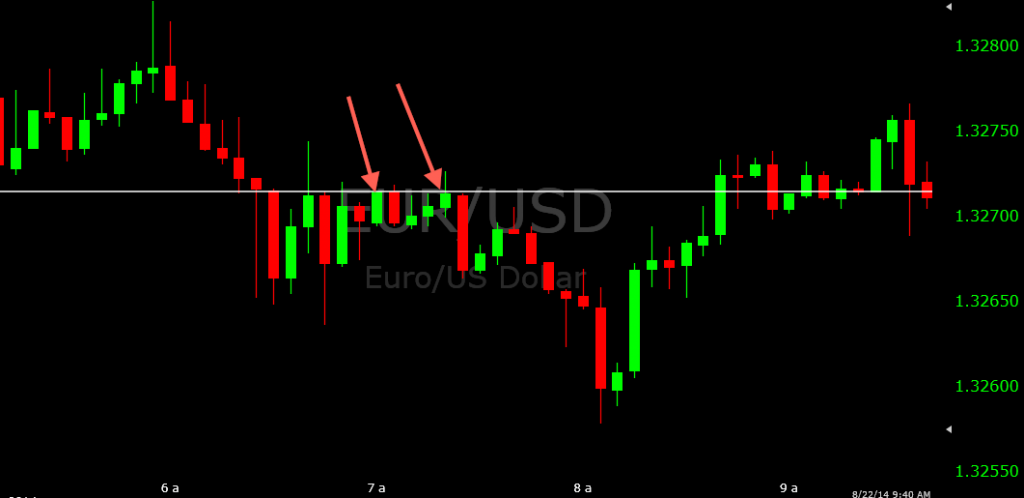
On the 6:40(AM EST) candle, price closed out around 1.3272. The next candle was bearish, while 1.3272 was rejected again on the 6:50 candle. So here we already had the basic footing of a resistance level in the market. A common question that traders have is what constitutes a “resistance level,” for example? Basically it can be as simple as a green/up candle followed by a red/down candle. Mainly, I’m just looking for how price acts around these levels – pivot points, high of day, low of day, any type of support or resistance created from previous price history – and, of course, how price acts on its own.
I addressed this matter in some detail in these posts:
Identifying Horizontal Support and Resistance from Previous Price History
Identifying Horizontal Support and Resistance from Previous Price History — Part 2
When the 6:55 candle was bearish, I felt I had what was necessary to support a put option set-up at 1.3272, expecting that the resistance level would keep price below. The trend was also slightly down.
Once price hit 1.3272 on the 7:00AM candle, I entered a put option. The trade received a nice boost down on the 7:05, and made challenges up to my entry point on the 7:10 and 7:15 candles, but the level held and ultimately expired about one pip in-the-money.
Given the set-up was still valid to me, I decided to re-enter the same trade, a put option at 1.3272, on the 7:20 candle. The 7:25 fell about five pips in my favor, before settling as about a four-pip winner.
In today’s trading, despite a grim early outlook, it came down to simply finding a good spot to trade. And since the situation was favorable, I was able to make the most of it and take two pretty good winning trades going with the trend.
As you can see below in the daily chart, the EUR/USD has been in a steep downtrend for the month of August, so with all the daily downtrends that have been frequent as of late, put options have tended to not be a bad idea.
The exchange rate is currently below 1.3200, which is a low that hasn’t been seen since the beginning of September 2013, about a year ago.
Related Content:
Trading Opportunities at Recently Created Levels of Support and Resistance

