Monday’s Trading of the EUR/USD – Attention to the Trend
August 11, 2014
Heed the trend
Having consideration for the trend is a large part of trading successfully. Ideally, all “newbie” traders should adhere to the idea of not necessarily trading with the trend, but rather not trading against it. It’s the best way to at least ensure some degree of avoiding poor trade results, in that you’re not stacking a very important factor against you. As I’ve stated in previous articles, trend trading is the one form that has stood the test of time as a profitable trading venture. It’s really something that’s been helping financial market traders earn profits for over a hundred years at this point. And ideally, it should be used in some form or another in trading in which profits are derived from investing into the belief that the market will be going in one direction or the other.
Indeed, taking trades against the trend can be perfectly viable in some circumstances, but it should probably wait until you’re a bit further in your trading career. Even then, these types of set-ups should naturally be taken more sparingly than those that coincide with the direction of the trend. Or in overall neutral markets, where price doesn’t have a predilection for one direction or the other.
I did write a post a few weeks ago from the time of this writing regarding how to effectively trade against a trend. It can be found here.
Monday’s Trading of the EUR/USD
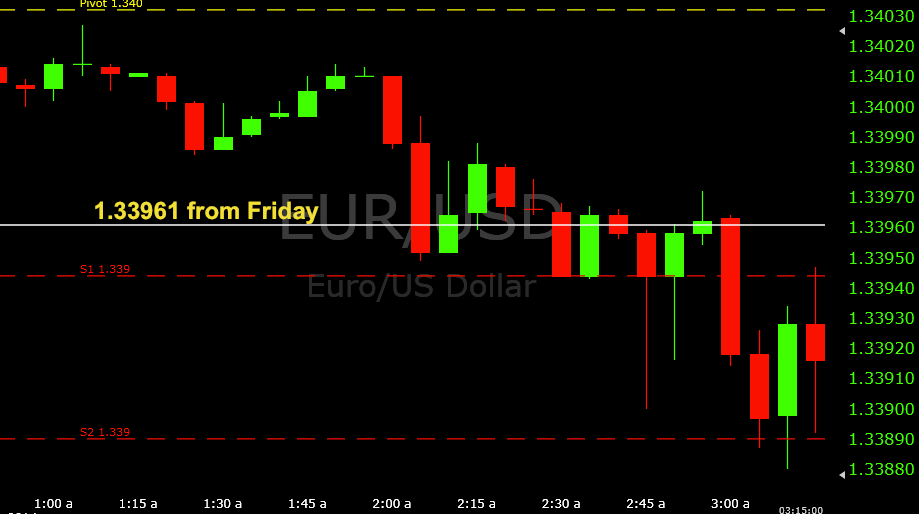
1. First off, I know the white line in the images in this post might seem strange given there is no obvious reference as to what it pertains to based on the candle arrangements representing the price history. It is simply the 1.33961 price level that came into play during Friday’s trading. It could easily have been something to delete, but I was still curious as to how price might act around it so I kept it on the chart. I hope it doesn’t serve to cause any confusion when looking at some the images in this article. But as fate would have it, I did use this price level for my first trade.
2. The support 1 level of 1.33944 was the first thing in play today. It did act as support at its first touch at 2:30AM EST, but there wasn’t a clear rejection of this level or any hint that buyers wanted to move this market higher, as the price only moved back up a couple pips.
When it came down to 1.33944 a second time, there was a false break, nearly a five-pip wick on the 2:45 candle, which is large considering the time of day. Another attempted close below support 1 occurred on the following candle, but the buyers once again pushed it back up.
Based on my understanding of market dynamics, usually when price falsely breaks a level (i.e., moves down briefly only to come back up to the support or resistance level), it tells me that the direction of the false break is likely to prevail in time. In this case, the buyers were able to preserve their desire to keep the market around support 1 and near the 1.3400 whole number; the sellers were likely bound to win out eventually given the surge they were able to create. The buyers’ wish to keep the market that high is artificial in a way, and the sellers are demonstrating that their ability to push the market lower is genuine and that any up movement is likely to be merely temporary and hanging on by a thread.
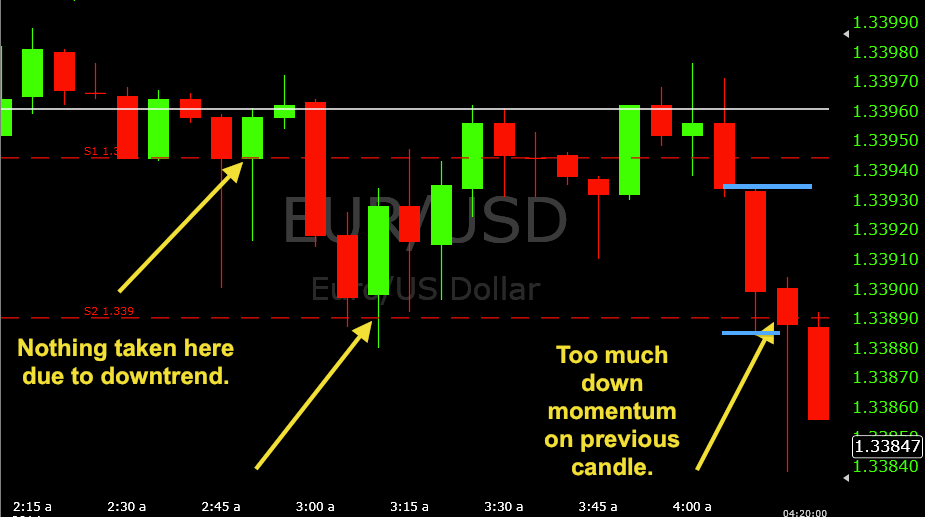
3. When price finally broke support 1 on the 3:00 candle, support 2 became the next area of interest as an area for call options. While a call option trade did set up the way I normally want it to based on price action around the predetermined price level (which serves as the entry point), I passed on it due to the downtrend at the moment.
To me, it felt entirely conceivable that price could continue going down. Trends often do breakout within an hour of the European market open. The trade would have worked out, but I felt fine passing on it. I would later do the same thing at support 2 about an hour later.
4. On the way back up to support 1 (1.33944), I was interested in put options at this area. But given that price had also formed a congestion area above support 1 recently, I decided to wait a bit and see if it would return back to up to the top of that. In terms of a price level, it roughly coincided with where the white line is located – 1.33961.
Support 1 wouldn’t have been a bad trade. There was a touch and rejection and a subsequent re-touch, but I believed some movement back up to the top of the previous congestion (again, where the white line is situated roughly) could be likely, at least possibly in the form of wicks. This did occur and once I saw rejection on the white line and price seemingly hitting a ceiling here, I decided to get into a touch of 1.33961 on the 3:30 candle.
This trade had some time to develop, which I liked. All four of the five-minute candles that encompassed the price movement during this trade were red, and I had a three-pip winner by expiration.
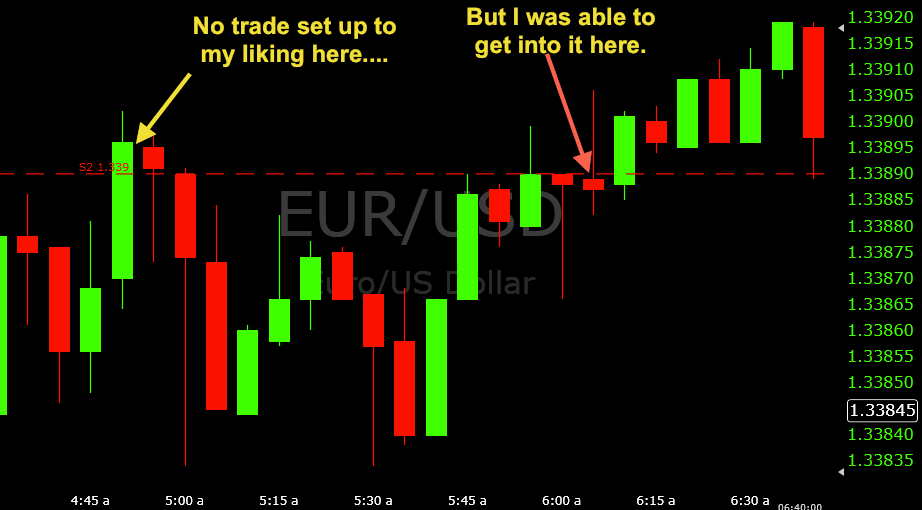
5. Once support 2 was broken, I began considering that level for put options. The trend was clearly down, so support 2 (1.33890) could reasonably serve as a good area for that.
Price did get up to 1.33890 on the 4:50 candle, but there was a close above the level. Given that it did not set up to my liking there I waited for perhaps another opportunity. This came into clearer view just before 6AM EST. The market got up to 1.33890 on the 5:45 candle, but there was a decent charge up to this level so I waited. There was a break and close right at the level on the 5:55, followed by a nice long wick down on the 6:00. This told me that selling was still in play so I got into the re-touch of 1.33890 on the 6:05.
This trade was a bit of a rollercoaster at first. It initially broke against me by a couple pips before closing back below at the ten-minutes-to-go mark. Then the next candle stayed in the money for a little while before closing out of it by a little bit over a pip. The closing candle made a slight comeback but I still ended up losing by around half-a-pip.
Overall, 1/2 ITM today, but still running at about 70% ITM for the summer overall.


