My Approach to Forex Trading: #1
I have been meaning to start up a forex trading blog for quite some time. I’ve received several requests over the months over how I approach forex, and it comprises the bulk of my trading efforts. Over the course of several posts, I hope to lay out my ideas with regards to trade examples (similar to my binary options posts), money management, placement of stop-losses, trailing stops, and take-profit targets, and other general philosophy. However, the trade example posts might be a bit different from the way I do my binary posts since I can’t guarantee that I’ll actually take a forex trade every single week.
Due to time restrictions in my daily schedule, I limit my trades to the daily chart only. That way, I only need to check the charts one time per day and it’s a lot less stressful than trading the lower compressions (4-hour, 1-hour, 30-minute, etc.), which would entail needing to keep tabs on any open positions multiple times throughout the day. Also, although I do my trading through ATC Brokers and place position through their MT4 platform, I still use AmeriTrade’s ThinkOrSwim software to look at the markets. I have the settings configured such that each daily bar contains data through the New York “market close,” which is more or less considered to be 5PM EST.
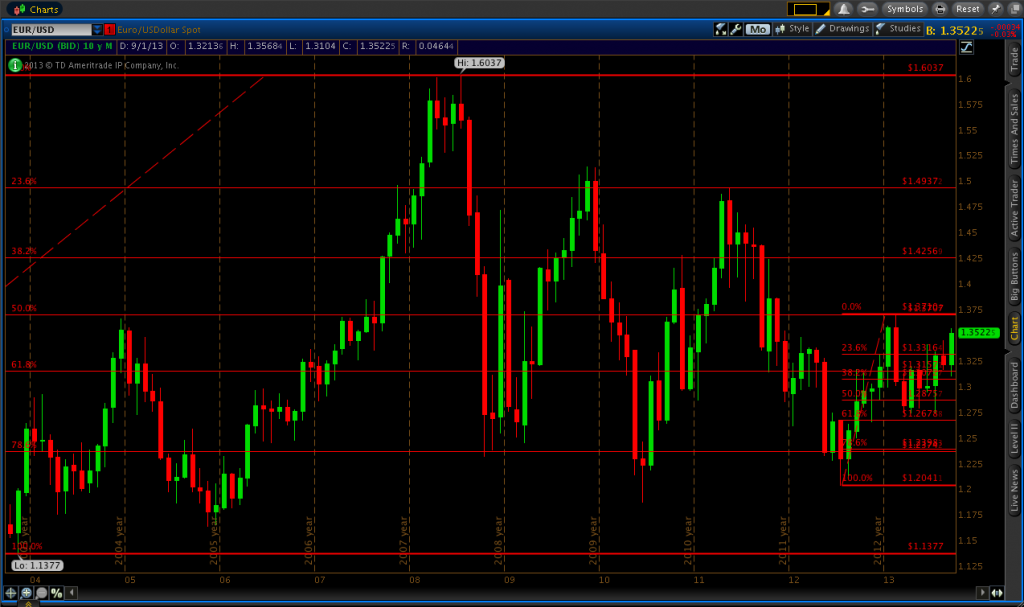
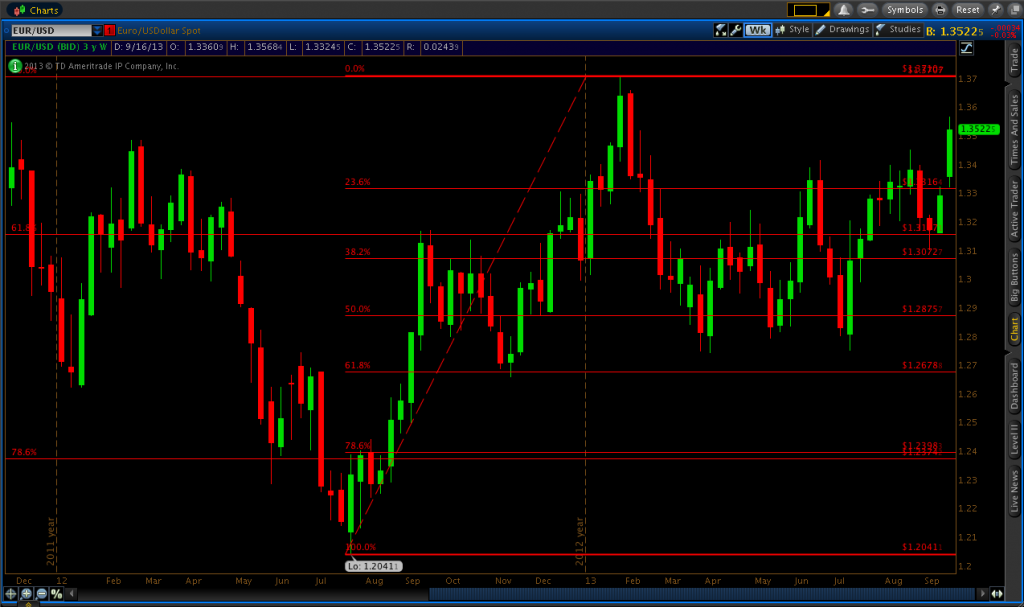
On each pair that I trade, I draw in Fibonacci levels on both the monthly and weekly charts, drawing from the high-end to low-end points of the price data range. On the EUR/USD monthly chart, I have Fibonacci levels ranging from 1.1377-1.6037, and from 1.20411-1.37104 on the weekly chart. I usually don’t like to draw them in on anything lower than the weekly time chart, given that the ones from the highest compressions tend to be the most robust. Moreover, drawing too many will simply put way too many lines on the chart and they lose their value this way and can easily induce confusion.
Fibonacci retracements drawn in on the monthly chart:

Fibonacci retracements drawn in on the weekly chart:

You’ll find throughout the series of forex posts that I make that I rely very heavily on these Fibonacci retracements levels to help me find quality trade set-ups. The first trade that I’d like to share is one that I made on the EUR/USD on September 3, 2013.
Throughout the latter half of August, price had been hanging strong between the 1.3300 and 1.3450 price range. I had no position open on the EUR/USD at the time, as my strategy was to simply wait for it to break out of this consolidation area before looking to take an actual trade on the pair.
Once it did break out and close below the 23.6% Fibonacci level of 1.33164 on August 29, I set a buy limit order at 1.31571 (i.e., when price hits 1.31571, a trade will go into effect). This price noted the 61.8% Fibonacci level from the monthly compression, so needless to say, this was potentially a very strong area to take a trade. I placed my stop-loss at 1.30427, some way below the next Fibonacci line (to give the trade some breathing room), with my take-profit set at 1.33164, or the next Fibonacci line above where I placed my order.

This didn’t represent an ideal reward-to-risk ratio, as I was taking two pips of risk for every three pips of potential profit. (Reward-to-risk ratio can be found by taking the pip-value difference between entry and stop-loss, and entry and take-profit. In this case it was 114 pips and 159 pips, respectively.)
After the price jump on the September 9 candle, which effectively saw this trade go in my favor, I moved my stop loss from the initial point of 1.30427 up to 1.31950, just below the whole number. This is called a trailing stop and helps you to protect any profit you’ve already made. It certainly isn’t any good if a trade is going well only to see it reverse course and you wind up with nothing to show for it. The following day I moved my stop up to 1.32166, or below the low of the previous day’s candle, locking in more profit. By September 11, the market hit my take-profit level of 1.33164 and this trade closed out 159 pips in favor.