Reliably Finding Strong Price Levels to Trade
August 27, 2014
The European session opened up with a decent amout of volatility on the GBP/JPY, with large wicks on the opening candles spanning over fifteen pips. The market first rose up to the daily pivot level of 172.264 although no trade set up in the way in which I approach the markets, given the close above the level.
Trade #1
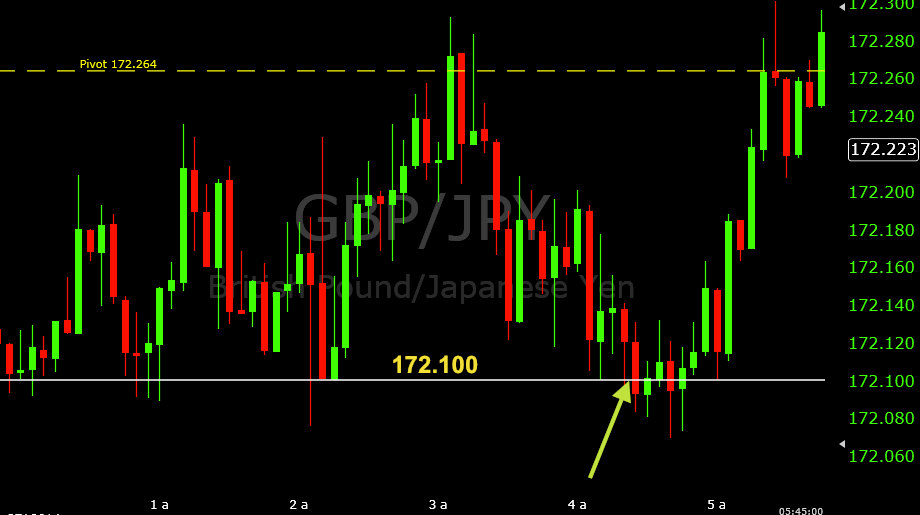
The pivot did eventually hold and on the way down I began targeting 172.100 as a support level for call options. In the image below, you can basically observe why I had this level marked off as having trade potential. There were basically three prior instances within the past few hours that had supported 172.100 as a support level. And on all three occasions it had acted as a shelf for price to rest on.
Of course, I needed some sort of price action confirmation for me to get into a call option. I never trade just the level itself, as it’s too risky. Support and resistance by itself in isolated form isn’t a great strategy/system to trade, even if you’re targeting major levels only like pivot points and the one seen here created from previous price history. It’s important to consider the price action, as well, in addition to trend and momentum, most notably.

The 4:10(AM EST) candlestick did bounce off 172.100, as did the 4:20 candle. The case of two five-minute candles showing rejection gave me enough confidence in looking at getting into a call option on the next touch of 172.100. Oftentimes, in the case I’m considering a trade against a recent trend or bout of movement contrary to the direction of my intended trade, I’ll look at more than one rejection (confirmation) candle to help validate its robustness as a price level worthy of trading. As such, this is what I did here.
I got into a call option on the touch of 172.100 on the 4:25 candle. This trade did spend a decent amount of time against me, going two pips out of favor before rising a pip in favor. In the end, I wound up with a two-tenths of a pip winner. This is a slim margin indeed, and one could definitely say some luck was involved. Nevertheless, the general prediction that price would hold on the fourth consecutive test of 172.100 did come to fruition and price began to break higher again just after 5AM EST.
Trade #2
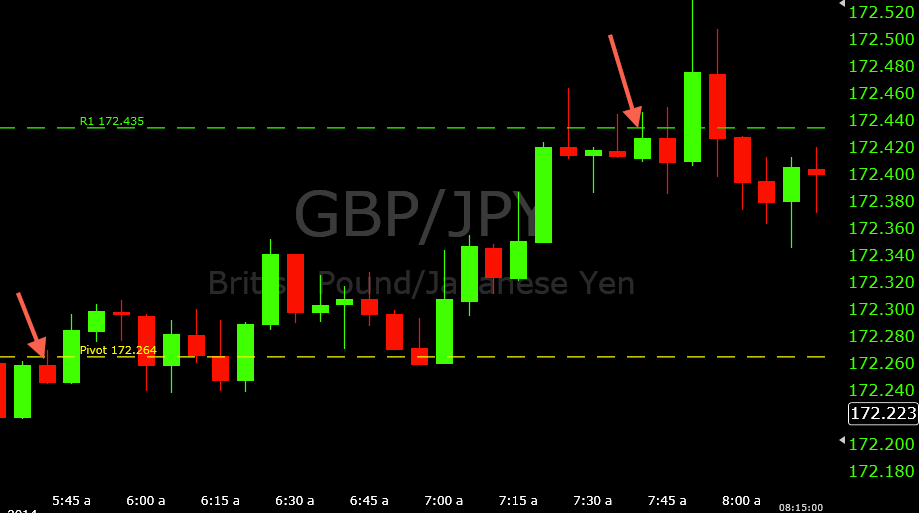
Pivot re-established itself as a resistance level on the 5:20 and 5:25 candles, neatly closing and opening at the level and rejecting further upward movement. The bearish 5:30 candle was exactly what I was looking for in terms of showing that selling movement was in play. It’s really exactly what you might want to see at a resistance level when you’re considering a put option set-up. After all, if you’re considering a put option trade, you might want to actually observe some sort of selling tendency in the market first as evidence supporting that position.

The 5:35 candle did not touch the pivot level, but the 5:40 did where I got into a put option at 172.264. This produced another rejection initially, but buying movement continued afterwards and I lost this trade by a couple pips.
Trade #3
The market would hang around pivot until around 7AM, although no real call option opportunities emerged. Given the uptrend all the way from 172.100 and through the pivot, it wasn’t entirely surprising that resistance 1 (172.435) was the next level in sight.
And like the pivot level in the previous trade set-up, the price action around resistance 1 was similar. Price rejected 172.435 on the 7:25 candle, held below on the 7:30 (reaching five pips below resistance 1 at one point), before coming up to reject again on the 7:35. Like previously, I waited for this second rejection of the level to help validate that price as a solid area for reversal, given I was up against an uptrend.

After the second rejection, I looked to get into a put option on the next touch of 172.435, which occurred on the 7:40 candle. This trade spent a little time out-of-the-money, but by no more than a pip or so, before going up to five pips in favor, before closing as a three-pip winner. This level did hold, so I could also feel good about the overall idea behind the trade and my reading behind the market.
Overall, a 2/3 ITM day.