Trading Opportunities at Recently Created Levels of Support and Resistance
August 3, 2014
Last Friday’s trading of the EUR/USD didn’t amount to much in the way of trading opportunities setting up at pivot points. Naturally, when the gap between them is large, it carries with it the reality that set-ups along them will be in less abundance. Daily pivot points are truly a favorite method of mine in finding where the turning points in the market may lie. But if the previous day offered a large trading range, then the next day’s pivot points will naturally be spaced wide apart being where they are placed is mathematically determined by yesterday’s open, low, high, and closing price. So you may have to resort to other means to find suitable areas to trade. And that was basically the story of today’s trading.
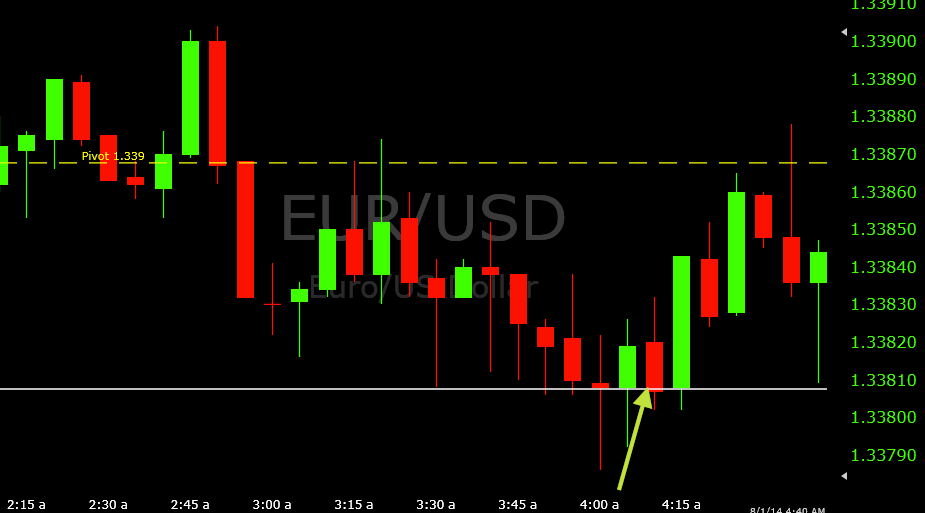
1. To begin the morning, price fellow below the pivot level before a series of wicks started to test down toward 1.3381. This first occurred on the 3:30 candle, and tests occurred toward 1.3381 on four consecutive candles just before the start of the 4AM (EST) hour. The 4:00 candle broke below, but finished as a doji right along the level.
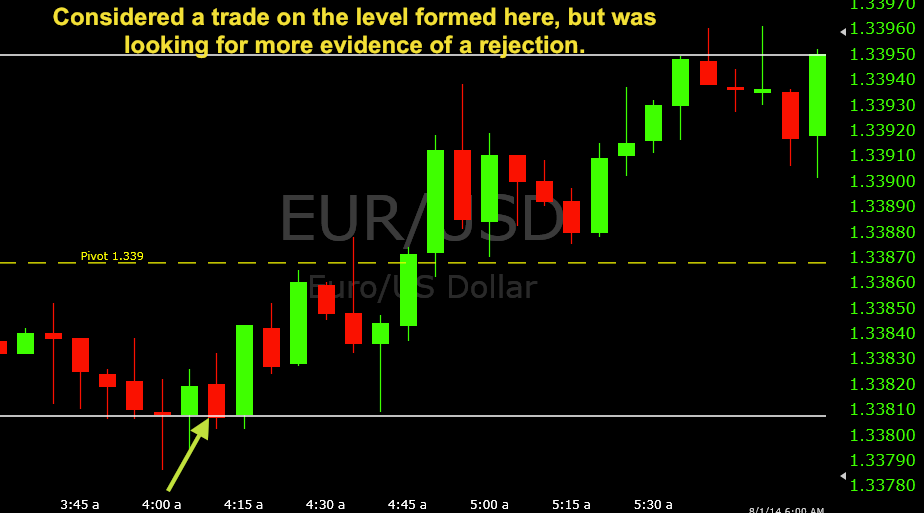
At this point, I still wasn’t entirely sure whether it would be a worthwhile set-up to consider. The false break below 1.3381 could entail that the market might eventually wish to go there. But there is also something to be said that buyers keep bringing it at or above that level despite all the consecutive tests down there. To me, it seemed like 1.3381 was a balancing point for the EUR/USD before possibly reversing.
When I got a green 4:05 candle, it helped in evidencing the opinion that 1.3381 could hold. So on the 4:10, I let price get down to 1.33808 (where the white line is drawn in the image below) before taking a call option, expecting it to hold at least briefly. It got the hop I was looking for on the 4:15 and I wound up with a good winning trade off a recently created price level.
2. A touch of the pivot level occurred on the 4:35 candle. It held and suggested the pivot could hold for put options and perhaps a channel formation. An immediate re-touch did not happen and fell back down to the 1.3381 level, before a charge back up and above the pivot. This is not an instance where I take the re-touch, especially when it’s covering a good range of distance in one direction in a short period of time. Granted, it had only moved about six pips north in less than ten minutes, but relative to time of day and the fact that it was a Friday, that was actually a notable move. So I decided to pass on this trade.
3. After the break of pivot, the market finally seemed to want to break in the upward direction. It did stall, but the false break on the 4:55 candle suggested more upward movement to come.
A formation of a resistance level did technically form right around 5AM, but given that the market did not return to the pivot point, I didn’t feel there was significant selling pressure to justify a put option there.
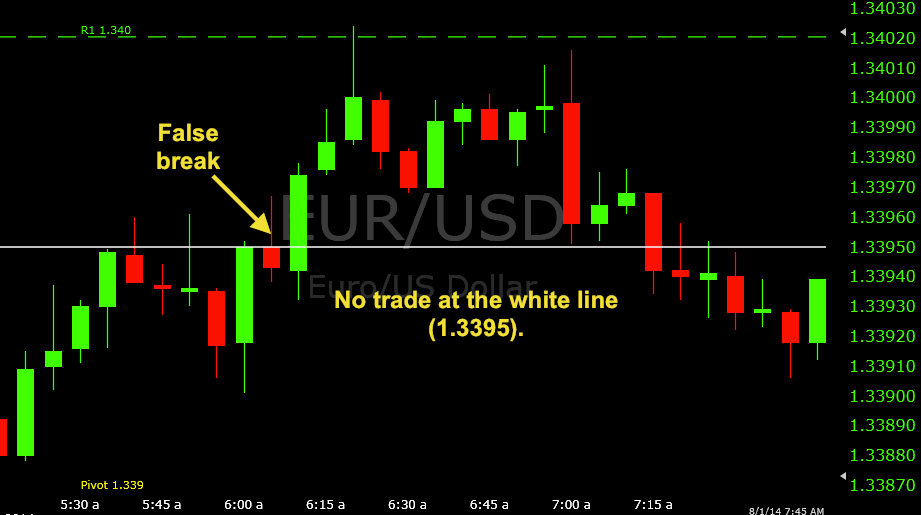
A potential trading opportunity did form, however, along the 1.3395 level after the rejection on the 5:50 candle. However, this turned out very similar to the pivot trading set-up that didn’t materialize in discussion point #2. Price fell down from 1.3395 by 4-5 pips, before making a move back up. I was looking for one further rejection of 1.3395 to help validate it as a reasonable area for put options, but that didn’t happen.
The 6:05 candle formed a false break of 1.3395. At this point, I felt it was best to stay out of anything at the white line due to the uptrend and the fact that the 1.3400 whole number and resistance 1 were directly overhead and more realistic targets.
4. The market did touch resistance 1, but no re-touch was in store. The whole number of 1.3400 held quite well as you can tell from the image, but given the test of resistance 1, I felt it was too risky to settle for the whole number as a point of entry for a put option.


