Using Binary Options to Trade Stocks
August 22, 2014
In trading, it’s often best to stick with what you’re familiar with and good at. Positive habits tend to build positive results in all facets of life, and it really isn’t any different when it comes to trading. Therefore, I tend to stick with currency pairs, namely major currencies (like EUR/USD, GBP/JPY), because I’m familiar with the way in which they move. I also stick with the same timeframe, as well, over 99% of the time (five-minute chart).
But every now and then, I do mix it up somewhat. About once every couple months I might trade one-minute options, perhaps longer timeframe options (rarely and haven’t for a long time), or a different asset altogether. In this case, I decided to venture over to trading a particular stock – Apple Inc. (AAPL) – given the time I had available to trade was a bit later in the day. It could spice up my routine and my blog at the same time from the usual rigmarole of currency trading.
Stocks have a different sort of price action from currencies. Currencies can definitely be a lot more volatile. There are usually multiple ebbs and flows in the direction and strength of a trend or price movement during the day. It’s natural, as currencies basically reflect the economic health or conditions of a particular country or jurisdiction. Forex is a 24/5 market, so news announcements are released during trading hours, and spikes in volatility can be expected around these times.
Stock prices, on the other hand, reflect the health of a given company and news releases (e.g., acquisitions, earnings reports) tend to be posted either before or after market hours. Stocks are only traded during a select fraction of the day (usually for around seven hours depending on what market it is), five days a week, unless a national holiday shuts down the markets for a day. So the price action tends to be a lot smoother. It’s really up to each individual to determine what kind of trading preferences he or she has. Some prefer forex, because you can trade at any time during the day, or they enjoy the more active movement. And some prefer equities/stocks because it simply fits who they are as a trader in whatever way(s).
So I’d like to share my AAPL trades for Friday. I also have a previous post on AAPL trades that can be found here.
Trade #1
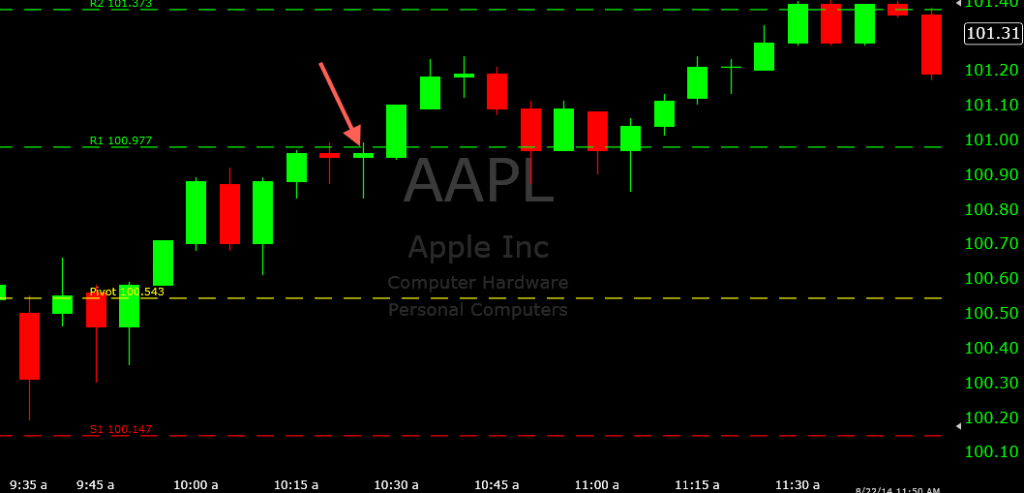
The U.S. markets (based in New York) officially open at 9:30AM. I didn’t begin trading the markets until close to 10AM. Price was working around the daily pivot level at the market open, but I probably would have avoided any trades around here – namely, put options at the pivot. The thing about trading stocks is that the price action isn’t continuous. There are five trading breaks during the week – between each weekday and the weekend – so in the beginning of equities trading I usually like the market to break in whatever direction it happens to feel inclined to go. In this case it wanted to move into an uptrend and broke the pivot leading into the morning.
My first trade occurred at the resistance 1 level of 100.977. There was some congestion/indecision in the middle of the pivot-resistance 1 channel, nearly touched 100.977 on the 10:15 candle, and rejected it on the 10:20. All this led me to believe that the likelihood of at least a temporary reversal (or having it hold under the level for under ten minutes) was reasonably strong.
Consequently, I took a put option on the 10:25 candle upon the touch of 100.977. All I needed was a hold under resistance 1 by the end of the following candle to get started on the right foot. The 10:25 candle did settle under, and was up by 0.15 by one point. But the closing candle did not ultimately respect resistance 1 and I lost this trade by about 0.13.
Trade #2
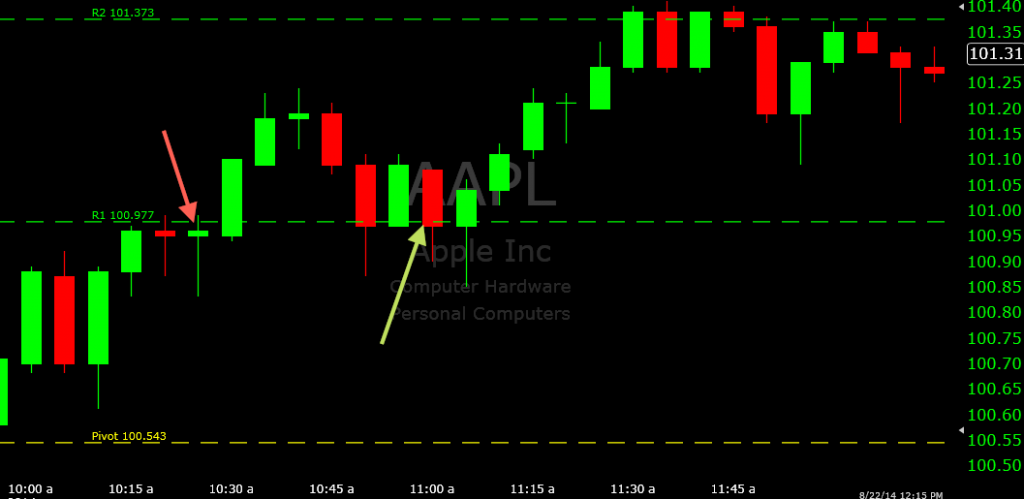
Price stalled in the middle of the resistance 1-resistance 2 channel and fell back down to 100.977. I did not receive a perfect rejection of resistance 1 here. The 10:50 candle fell about 0.10 below the level and closed slightly beneath it, as well. The 10:55 showed that some buying orders were indeed occurring on some level at resistance 1, which gave me a clue that a call option down around resistance 1 could be a good area. Like yesterday’s post, and for those of you who use pivot points as a support and resistance tool, trades don’t necessarily have to be taken at these levels themselves. Sometimes the evidence suggests that that may not be the best route to take.
In this case, since price formed a line of support just under resistance 1, I in turn used the bottom of the 10:50 candle/open of the 10:55 as support instead. When price touched here on the 11:00 candle, I entered a call option. Despite going out of favor in the early goings, I eventually won this trade by about 0.25.
Trade #3
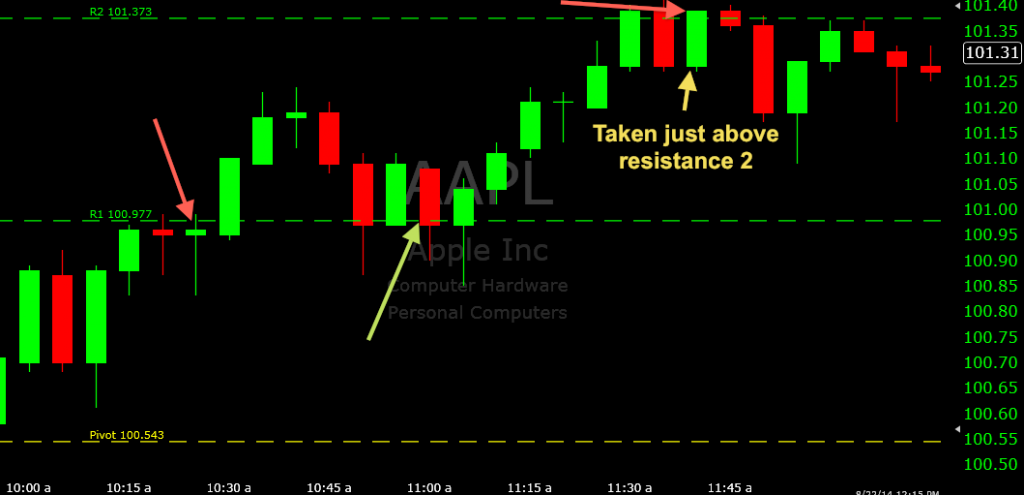
After this, price continued climbing. Nothing materialized at the daily high (thus far) in the middle of the resistance 1/resistance 2 channel, and began targeting resistance 2 (101.373).
This trade turned out similar to the previous one. While congestion was shown around this level, it didn’t show a precise rejection of the level. Instead the line of resistance occurred 0.01-0.02 above it, as shown by the close of the 11:30/open of the 11:35 candle. And this, of course, is fine by me. It still shows that the general area is targeted as a potential reversal/congestion point. And it also allows for a slightly better entry than just resistance 2 itself given we’re doing a put option here.
When price came back up to 101.390 on the 11:40 candle, I entered a put option, expecting the general resistance 2 area to hold. The closing candle was the very next one, and I did receive enough of a bounce to win this trade by just a few cents. The real bounce came on the candle thereafter. But in binary options, you simply need to be on the right side of the fence at a given time, so small winners count just the same as large ones.
That was it for the week, a 2/3 ITM day, and 8/11 ITM (72.7%) for the week overall.


