Welcome to “Uptober”: Expectation VS Reality
Bull Trap Bonanza – The Descending Channel Is at It Again.
Historically, October is the best month of the year for Bitcoin but this particular October hasn’t started with the best foot forward. We just experienced another false break of the descending channel and the bulls continue to get caught off guard as they did since March.
Thus far, October has not turned into Uptober and in fact, it’s been more like “Selltober” or “Octobear”, which have become popular monikers for this particular month on X (formerly Twitter).
According to CoinGecko, the overall crypto market thinned by about $200 billion in October, and considering that we are just 4 days in, it could get much worse. Bitcoin isn’t fairing any better, having dropped below $60,000 for a brief moment before recovering and reaching $61,300 where it is trading at the time of writing.
But maybe there’s no need to get alarmed because 9 out of the last 11 October months have been bullish for Bitcoin even if the month started with a dip. And speaking of dips, Quinn Thompson, chief investment officer at Lekker Capital recently shared his opinion that buying the dip is the way to go. “I don’t usually give very short-term views but seems like a no-brainer to be bidding this area […]”
Most of the Bitcoin gains happen in the second part of October, so the story is not written yet. For example, last year Bitcoin dropped 7% in the first part of October only to shoot up 30% by the end of it.
On the other hand, usually, social media is buzzing with mentions of “Uptober” but this year we are getting memes of “Selltober” and “Octobear”. There’s still a long way to go, so it’s too early to make speculations about what type of October we’ll get.
Chart Analysis – BTC/USD
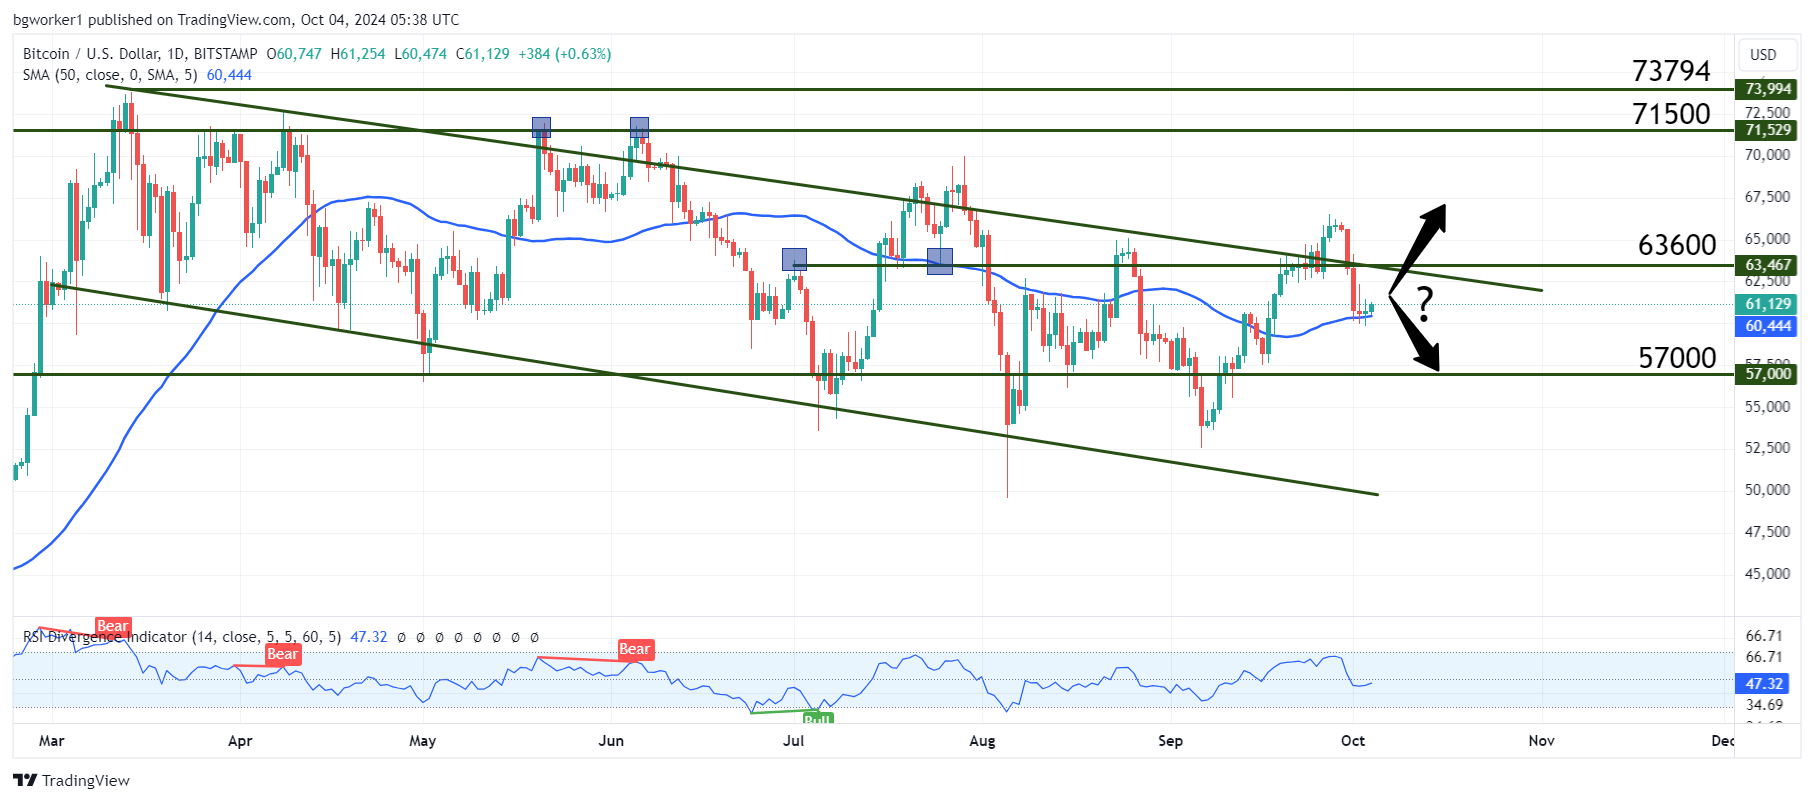
Bitcoin is currently changing hands at $61,300 and it looks to bounce off the 50-day Moving Average. The bearish momentum has been stopped by the MA: after two huge red candles that touched the 50 MA, the price stopped and the pair printed two indecision candles (long wicks, small bodies).
The current candle seems to have some bullish impulse but of course, it’s too early to tell because the candle is still not closed. By close time it could turn into a shape similar to the previous two, which would show more indecision.
Depending on the scenario that comes true (bounce or break of the 50 MA). We will get our next short-to-medium-term direction: $63,600 or $57,000.